Estimated Value: $283,000 - $323,000
3
Beds
2
Baths
2,609
Sq Ft
$116/Sq Ft
Est. Value
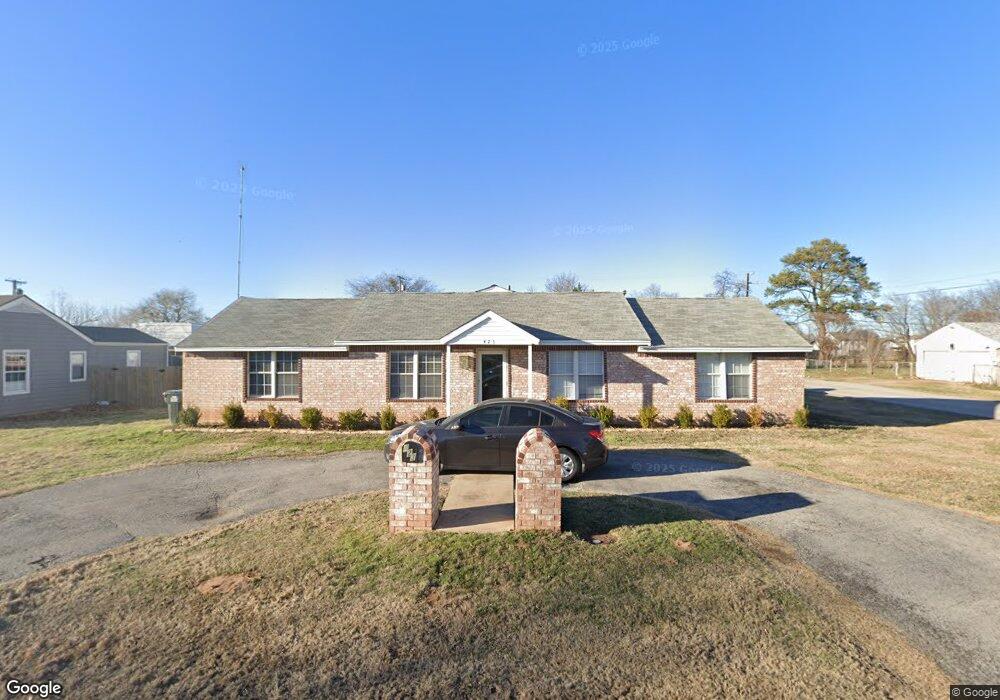
About This Home
This home is located at 423 E Beaver St, Jenks, OK 74037 and is currently estimated at $301,591, approximately $115 per square foot. 423 E Beaver St is a home located in Tulsa County with nearby schools including Jenks West Elementary School, Jenks Middle School, and Jenks West Intermediate Elementary School.
Ownership History
Date
Name
Owned For
Owner Type
Purchase Details
Closed on
Dec 30, 2016
Sold by
Turner Lora
Bought by
Greene Alex C
Current Estimated Value
Home Financials for this Owner
Home Financials are based on the most recent Mortgage that was taken out on this home.
Original Mortgage
$106,000
Outstanding Balance
$86,609
Interest Rate
4.08%
Mortgage Type
New Conventional
Estimated Equity
$214,982
Purchase Details
Closed on
May 7, 2007
Sold by
Greene Larry Allen and Greene Jeanette Ann
Bought by
Greene Rita Lorraine and Greene Emma Mae
Home Financials for this Owner
Home Financials are based on the most recent Mortgage that was taken out on this home.
Original Mortgage
$69,960
Interest Rate
6.16%
Mortgage Type
Unknown
Create a Home Valuation Report for This Property
The Home Valuation Report is an in-depth analysis detailing your home's value as well as a comparison with similar homes in the area
Home Values in the Area
Average Home Value in this Area
Purchase History
| Date | Buyer | Sale Price | Title Company |
|---|---|---|---|
| Greene Alex C | $132,500 | First American Title & Abstr | |
| Greene Rita Lorraine | $106,000 | First American Title & Abstr |
Source: Public Records
Mortgage History
| Date | Status | Borrower | Loan Amount |
|---|---|---|---|
| Open | Greene Alex C | $106,000 | |
| Previous Owner | Greene Rita Lorraine | $69,960 |
Source: Public Records
Tax History
| Year | Tax Paid | Tax Assessment Tax Assessment Total Assessment is a certain percentage of the fair market value that is determined by local assessors to be the total taxable value of land and additions on the property. | Land | Improvement |
|---|---|---|---|---|
| 2025 | $2,795 | $22,283 | $1,751 | $20,532 |
| 2024 | $2,573 | $21,223 | $1,684 | $19,539 |
| 2023 | $2,573 | $20,212 | $1,973 | $18,239 |
| 2022 | $2,474 | $19,249 | $2,599 | $16,650 |
| 2021 | $2,387 | $18,333 | $2,475 | $15,858 |
| 2020 | $2,335 | $18,333 | $2,475 | $15,858 |
| 2019 | $2,351 | $18,333 | $2,475 | $15,858 |
| 2018 | $2,357 | $18,260 | $2,402 | $15,858 |
| 2017 | $2,318 | $18,260 | $2,402 | $15,858 |
| 2016 | $2,296 | $17,648 | $2,310 | $15,338 |
| 2015 | $2,228 | $16,808 | $2,200 | $14,608 |
| 2014 | $2,279 | $16,808 | $2,200 | $14,608 |
Source: Public Records
Map
Nearby Homes
- 0 E A St
- 718 E Beaver St
- 711 E Karma Ave
- 504 E B St Unit 2102
- 504 E B St Unit 2101
- 504 E B St Unit 1103
- 504 E B St Unit 1104
- 0 Aquarium Dr
- 406 E B St
- 408 E E St
- 503 W C St
- 649 W 101st Place S
- 1010 N 3rd St
- 407 N Forest St
- 422 N Forest St
- 438 N Forest St
- 321 W J St
- 549 N Elm St Unit H
- 1317 N 1st St
- 1012 N Forest Place
- 413 E Beaver St
- 411 E Beaver St
- 210 S 5th St
- 422 E Beaver St
- 507 E Beaver St
- 412 E Beaver St
- 403 E Beaver St
- 408 E Apache St
- 504 E Beaver St
- 506 E Apache St
- 410 E Beaver St
- 402 E Apache St
- 511 E Beaver St
- 508 E Beaver St
- 404 E Beaver St
- 402 E Aquarium Place
- 512 E Beaver St
- 423 E Comanche St
- 515 E Beaver St
- 323 E Beaver St
Your Personal Tour Guide
Ask me questions while you tour the home.