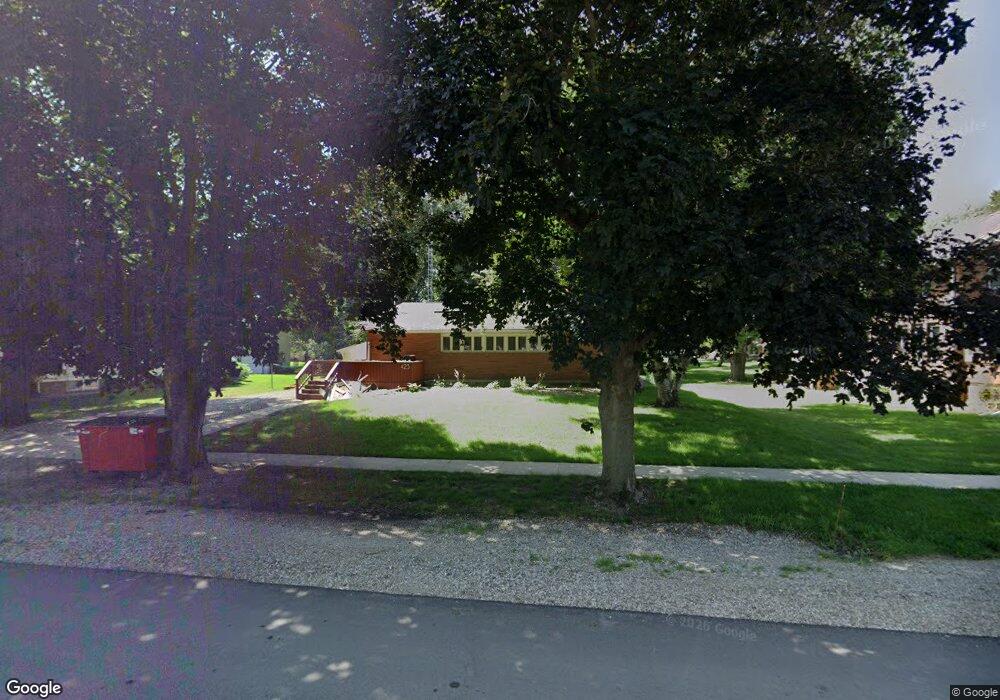
423 Maple St Sheffield, IA 50475
Estimated Value: $211,000 - $240,000
4
Beds
3
Baths
1,540
Sq Ft
$144/Sq Ft
Est. Value
About This Home
This home is located at 423 Maple St, Sheffield, IA 50475 and is currently estimated at $221,502, approximately $143 per square foot. 423 Maple St is a home located in Franklin County with nearby schools including West Fork High School.
Ownership History
Date
Name
Owned For
Owner Type
Purchase Details
Closed on
Mar 1, 2021
Sold by
Hegarty James and Hegarty Traci
Bought by
Woltjer Blayne
Current Estimated Value
Home Financials for this Owner
Home Financials are based on the most recent Mortgage that was taken out on this home.
Original Mortgage
$130,000
Outstanding Balance
$11,515
Interest Rate
2.7%
Mortgage Type
New Conventional
Estimated Equity
$209,987
Purchase Details
Closed on
May 27, 2015
Sold by
Siems Shea Marie and Jensen Shen M
Bought by
Hergarty James and Hegarty Traci
Home Financials for this Owner
Home Financials are based on the most recent Mortgage that was taken out on this home.
Original Mortgage
$112,000
Interest Rate
3.65%
Mortgage Type
Future Advance Clause Open End Mortgage
Create a Home Valuation Report for This Property
The Home Valuation Report is an in-depth analysis detailing your home's value as well as a comparison with similar homes in the area
Purchase History
| Date | Buyer | Sale Price | Title Company |
|---|---|---|---|
| Woltjer Blayne | $165,000 | None Available | |
| Hergarty James | $140,000 | None Available |
Source: Public Records
Mortgage History
| Date | Status | Borrower | Loan Amount |
|---|---|---|---|
| Open | Woltjer Blayne | $130,000 | |
| Previous Owner | Hergarty James | $112,000 |
Source: Public Records
Tax History
| Year | Tax Paid | Tax Assessment Tax Assessment Total Assessment is a certain percentage of the fair market value that is determined by local assessors to be the total taxable value of land and additions on the property. | Land | Improvement |
|---|---|---|---|---|
| 2025 | $3,214 | $213,400 | $14,400 | $199,000 |
| 2024 | $3,214 | $194,000 | $14,400 | $179,600 |
| 2023 | $3,294 | $194,000 | $14,400 | $179,600 |
| 2022 | $2,692 | $176,500 | $14,400 | $162,100 |
| 2021 | $2,692 | $139,500 | $14,400 | $125,100 |
| 2020 | $2,366 | $134,800 | $14,400 | $120,400 |
| 2019 | $2,212 | $129,000 | $0 | $0 |
| 2018 | $2,128 | $129,000 | $0 | $0 |
| 2017 | $1,990 | $119,300 | $0 | $0 |
| 2016 | $1,998 | $119,300 | $0 | $0 |
| 2015 | $1,998 | $120,800 | $0 | $0 |
| 2014 | $2,304 | $120,800 | $0 | $0 |
Source: Public Records
Map
Nearby Homes
- 421 Sherman St
- 122 S 3rd St
- 718 Gilman St
- 202 Brickyard Ct
- 200 Brickyard Ct
- 319 N 6th St
- 212 Park St
- 410 Brickyard Rd
- 602 Claydigger Run
- 409 Brickyard Rd
- 417 Brickyard Rd
- 419 Brickyard Rd
- 421 Brickyard Rd
- 416 Brickyard Rd
- 402 Brickyard Rd
- 411 Brickyard Rd
- 415 Brickyard Rd
- 400 Brickyard Rd
- 418 Brickyard Rd
- 600 Claydigger Run
Your Personal Tour Guide
Ask me questions while you tour the home.