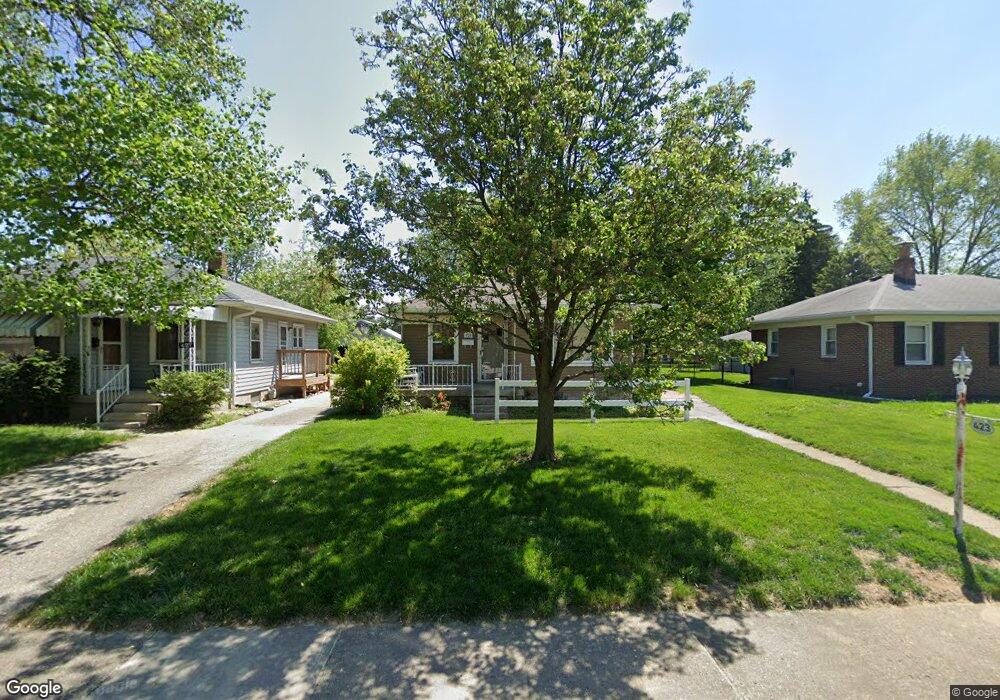
423 N 11th Ave Beech Grove, IN 46107
Estimated Value: $187,000 - $243,000
3
Beds
2
Baths
1,008
Sq Ft
$216/Sq Ft
Est. Value
About This Home
This home is located at 423 N 11th Ave, Beech Grove, IN 46107 and is currently estimated at $217,963, approximately $216 per square foot. 423 N 11th Ave is a home located in Marion County with nearby schools including Hornet Park Elementary School, Central Elementary School, and South Grove Intermediate School.
Ownership History
Date
Name
Owned For
Owner Type
Purchase Details
Closed on
Dec 26, 2017
Sold by
Dryden Diana K
Bought by
Wheeler Jill Elizabeth
Current Estimated Value
Home Financials for this Owner
Home Financials are based on the most recent Mortgage that was taken out on this home.
Original Mortgage
$64,600
Outstanding Balance
$54,487
Interest Rate
3.92%
Mortgage Type
New Conventional
Estimated Equity
$163,476
Purchase Details
Closed on
Dec 29, 2011
Sold by
Dryden Diana K
Bought by
Dryden Diana K and Wheeler Jill Elizabeth
Home Financials for this Owner
Home Financials are based on the most recent Mortgage that was taken out on this home.
Original Mortgage
$68,000
Interest Rate
3.98%
Mortgage Type
New Conventional
Create a Home Valuation Report for This Property
The Home Valuation Report is an in-depth analysis detailing your home's value as well as a comparison with similar homes in the area
Home Values in the Area
Average Home Value in this Area
Purchase History
| Date | Buyer | Sale Price | Title Company |
|---|---|---|---|
| Wheeler Jill Elizabeth | -- | -- | |
| Dryden Diana K | -- | None Available | |
| Dryden Diana K | -- | None Available | |
| Gill Thomas C | -- | None Available |
Source: Public Records
Mortgage History
| Date | Status | Borrower | Loan Amount |
|---|---|---|---|
| Open | Wheeler Jill Elizabeth | $64,600 | |
| Previous Owner | Dryden Diana K | $68,000 |
Source: Public Records
Tax History Compared to Growth
Tax History
| Year | Tax Paid | Tax Assessment Tax Assessment Total Assessment is a certain percentage of the fair market value that is determined by local assessors to be the total taxable value of land and additions on the property. | Land | Improvement |
|---|---|---|---|---|
| 2024 | $2,098 | $155,200 | $18,400 | $136,800 |
| 2023 | $2,098 | $155,600 | $18,400 | $137,200 |
| 2022 | $1,935 | $139,700 | $18,400 | $121,300 |
| 2021 | $1,545 | $117,600 | $18,400 | $99,200 |
| 2020 | $1,408 | $113,400 | $18,400 | $95,000 |
| 2019 | $1,225 | $102,600 | $13,500 | $89,100 |
| 2018 | $1,102 | $95,300 | $13,500 | $81,800 |
| 2017 | $1,027 | $88,000 | $13,500 | $74,500 |
| 2016 | $983 | $85,100 | $13,500 | $71,600 |
| 2014 | $926 | $83,100 | $13,500 | $69,600 |
| 2013 | $925 | $83,100 | $13,500 | $69,600 |
Source: Public Records
Map
Nearby Homes