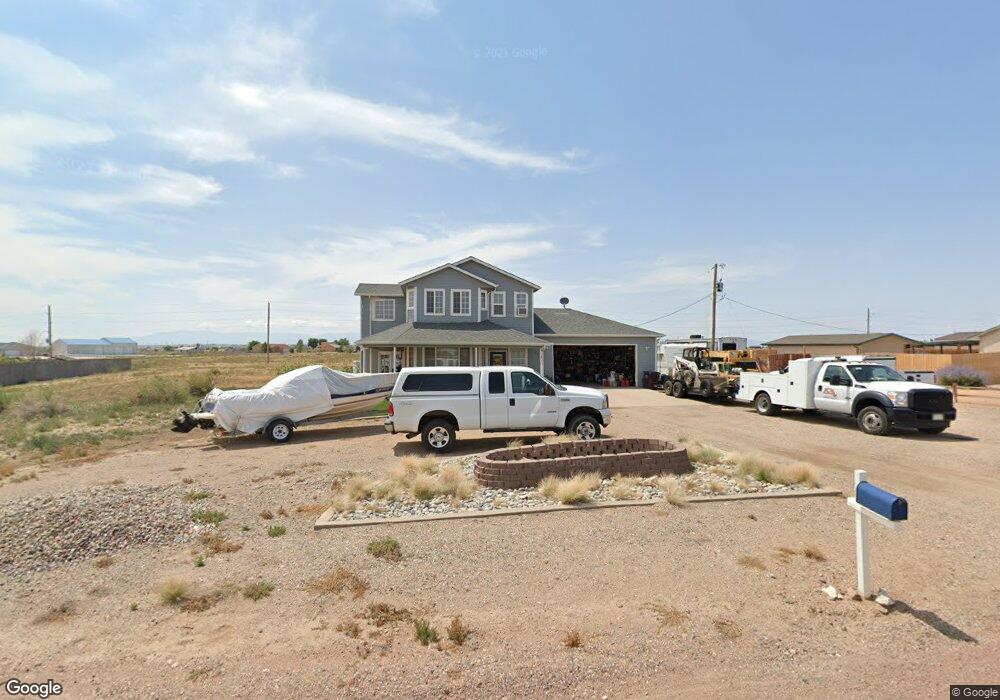
423 N Desert Cove Dr Pueblo, CO 81007
Estimated Value: $400,333 - $411,000
3
Beds
4
Baths
1,928
Sq Ft
$210/Sq Ft
Est. Value
About This Home
This home is located at 423 N Desert Cove Dr, Pueblo, CO 81007 and is currently estimated at $405,083, approximately $210 per square foot. 423 N Desert Cove Dr is a home located in Pueblo County with nearby schools including Prairie Winds Elementary School, Liberty Point International School, and Pueblo West High School.
Ownership History
Date
Name
Owned For
Owner Type
Purchase Details
Closed on
Feb 20, 2009
Sold by
Cash Amanda M and Cash Anthony J
Bought by
Rider Rylon K and Rider Kevin L
Current Estimated Value
Home Financials for this Owner
Home Financials are based on the most recent Mortgage that was taken out on this home.
Original Mortgage
$142,373
Outstanding Balance
$89,078
Interest Rate
4.91%
Mortgage Type
FHA
Estimated Equity
$316,005
Purchase Details
Closed on
Oct 28, 2004
Sold by
Branham Leon M + Jennifer M
Bought by
Cash Amanda M + Anthony J
Purchase Details
Closed on
Feb 23, 2001
Sold by
Neumiller Larry
Bought by
Branham Leon M + Jennifer M
Purchase Details
Closed on
Mar 9, 1998
Sold by
Pueblo West Metro Dist
Bought by
Neumiller Larry
Purchase Details
Closed on
Dec 29, 1992
Sold by
Lawyers Title Of Pueblo
Bought by
Pueblo West Metro Dist
Create a Home Valuation Report for This Property
The Home Valuation Report is an in-depth analysis detailing your home's value as well as a comparison with similar homes in the area
Home Values in the Area
Average Home Value in this Area
Purchase History
| Date | Buyer | Sale Price | Title Company |
|---|---|---|---|
| Rider Rylon K | $145,000 | Stewart Title | |
| Cash Amanda M + Anthony J | $155,100 | -- | |
| Branham Leon M + Jennifer M | $5,000 | -- | |
| Neumiller Larry | $4,000 | -- | |
| Pueblo West Metro Dist | -- | -- |
Source: Public Records
Mortgage History
| Date | Status | Borrower | Loan Amount |
|---|---|---|---|
| Open | Rider Rylon K | $142,373 |
Source: Public Records
Tax History Compared to Growth
Tax History
| Year | Tax Paid | Tax Assessment Tax Assessment Total Assessment is a certain percentage of the fair market value that is determined by local assessors to be the total taxable value of land and additions on the property. | Land | Improvement |
|---|---|---|---|---|
| 2024 | $1,936 | $19,290 | -- | -- |
| 2023 | $1,959 | $22,970 | $3,580 | $19,390 |
| 2022 | $1,799 | $17,930 | $2,330 | $15,600 |
| 2021 | $1,845 | $18,450 | $2,400 | $16,050 |
| 2020 | $1,515 | $18,450 | $2,400 | $16,050 |
| 2019 | $1,510 | $15,114 | $965 | $14,149 |
| 2018 | $1,309 | $13,092 | $540 | $12,552 |
| 2017 | $1,311 | $13,092 | $540 | $12,552 |
| 2016 | $1,192 | $11,929 | $637 | $11,292 |
| 2015 | $1,182 | $11,929 | $637 | $11,292 |
| 2014 | $1,111 | $11,203 | $756 | $10,447 |
Source: Public Records
Map
Nearby Homes
- 366 N Desert Cove Dr
- 1437 E Escondido Dr
- 1174 E Escondido Dr
- 535 N Boyero Ave
- 577 & 571 N Boyero Ave
- 1485 E Ithaca Dr
- 1070 E Sequoya Dr
- 1203 E Orchid Dr
- 1186 E Desert Cove Dr
- 634 N Boyero Ave
- 574 N Canvas Dr
- 522 N Mancos Dr
- 546 N Mancos Dr
- 562 N Mancos Dr
- 420 N Heather Dr
- 902 E Platteville Blvd
- 869 E Platteville Blvd
- 392 N Heather Dr
- 1058 E Ranch Dr
- TBD 1st Rd
- 431 N Desert Cove Dr
- 419 N Desert Cove Dr
- 419 N Desert Cove Dr Unit 11
- 439 N Desert Cove Dr
- 432 N Desert Cove Dr
- 420 N Desert Cove Dr Unit 4
- 420 N Desert Cove Dr
- 416 N Desert Cove Dr
- 447 N Desert Cove Dr
- 447 N Desert Cove Dr Unit 7
- 411 N Desert Cove Dr Unit 1.67
- 448 Desert Cove Dr
- 448 N Desert Cove Dr
- 455 N Desert Cove Dr
- 1271 E Bella Vista Dr Unit 5
- 456 N Desert Cove Dr
- 463 N Desert Cove Dr
- 406 N Desert Cove Dr
- 406 N Desert Cove Dr Unit 1
- 403 N Desert Cove Dr