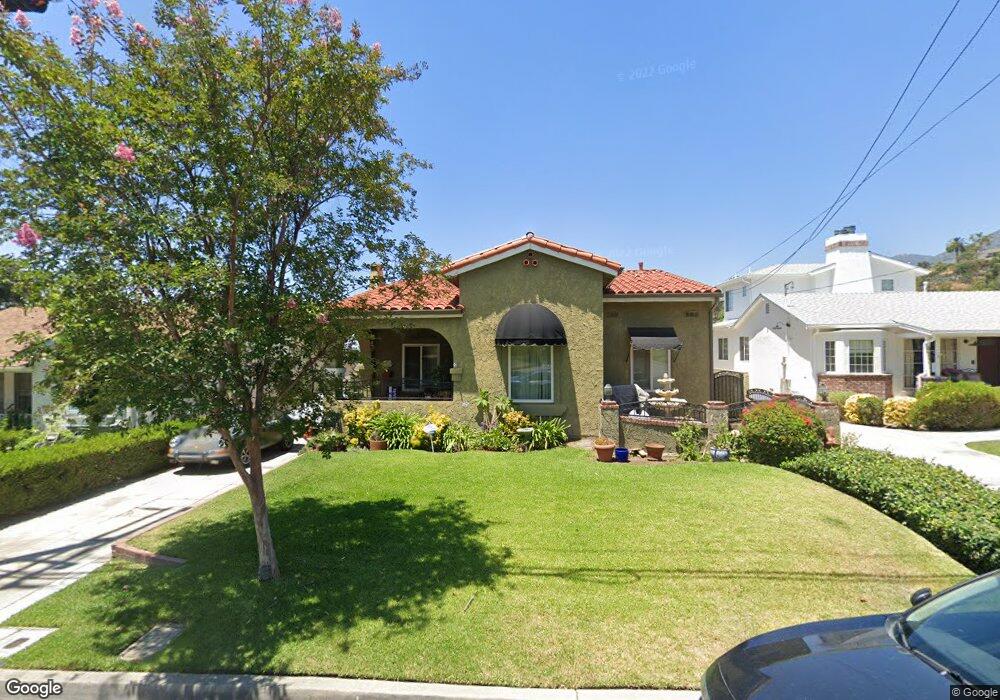
423 N Encinitas Ave Monrovia, CA 91016
Estimated Value: $1,169,486 - $1,390,000
3
Beds
2
Baths
2,106
Sq Ft
$590/Sq Ft
Est. Value
About This Home
This home is located at 423 N Encinitas Ave, Monrovia, CA 91016 and is currently estimated at $1,241,872, approximately $589 per square foot. 423 N Encinitas Ave is a home located in Los Angeles County with nearby schools including Mayflower Elementary School, Clifton Middle School, and Monrovia High School.
Ownership History
Date
Name
Owned For
Owner Type
Purchase Details
Closed on
Mar 25, 2020
Sold by
Lopez George and Lopez Consuelo B
Bought by
Lopez Jorge O and Lopez Consuelo B
Current Estimated Value
Home Financials for this Owner
Home Financials are based on the most recent Mortgage that was taken out on this home.
Original Mortgage
$730,000
Outstanding Balance
$643,414
Interest Rate
3.25%
Mortgage Type
FHA
Estimated Equity
$598,458
Purchase Details
Closed on
Aug 3, 2005
Sold by
Lopez George and Lopez Consuelo B
Bought by
Lopez George
Home Financials for this Owner
Home Financials are based on the most recent Mortgage that was taken out on this home.
Original Mortgage
$537,000
Interest Rate
5.48%
Mortgage Type
New Conventional
Purchase Details
Closed on
Feb 20, 2001
Sold by
Randall Thomas L and Talsky Connie F
Bought by
Lopez George
Home Financials for this Owner
Home Financials are based on the most recent Mortgage that was taken out on this home.
Original Mortgage
$283,400
Interest Rate
8.49%
Create a Home Valuation Report for This Property
The Home Valuation Report is an in-depth analysis detailing your home's value as well as a comparison with similar homes in the area
Home Values in the Area
Average Home Value in this Area
Purchase History
| Date | Buyer | Sale Price | Title Company |
|---|---|---|---|
| Lopez Jorge O | -- | Western Resources Title | |
| Lopez George | -- | Financial Title Co San Berna | |
| Lopez George | $315,000 | First American Title Co |
Source: Public Records
Mortgage History
| Date | Status | Borrower | Loan Amount |
|---|---|---|---|
| Open | Lopez Jorge O | $730,000 | |
| Closed | Lopez George | $537,000 | |
| Closed | Lopez George | $283,400 | |
| Closed | Lopez George | $7,000 |
Source: Public Records
Tax History
| Year | Tax Paid | Tax Assessment Tax Assessment Total Assessment is a certain percentage of the fair market value that is determined by local assessors to be the total taxable value of land and additions on the property. | Land | Improvement |
|---|---|---|---|---|
| 2025 | $7,252 | $528,020 | $326,070 | $201,950 |
| 2024 | $7,252 | $517,668 | $319,677 | $197,991 |
| 2023 | $7,088 | $507,518 | $313,409 | $194,109 |
| 2022 | $6,885 | $497,567 | $307,264 | $190,303 |
| 2021 | $6,745 | $487,812 | $301,240 | $186,572 |
| 2019 | $6,430 | $473,345 | $292,306 | $181,039 |
| 2018 | $6,191 | $464,065 | $286,575 | $177,490 |
| 2016 | $5,940 | $446,047 | $275,448 | $170,599 |
| 2015 | $5,810 | $439,348 | $271,311 | $168,037 |
| 2014 | $5,752 | $430,743 | $265,997 | $164,746 |
Source: Public Records
Map
Nearby Homes
- 102 Mill Run
- 425 N Canyon Blvd
- 347 Stedman Place
- 319 N Encinitas Ave
- 426 N Canyon Blvd
- 245 W Scenic Dr
- 34 Hidden Valley Rd
- 376 Hill St
- 250 N Primrose Ave
- 210 N Encinitas Ave
- 328 N Alta Vista Ave
- 1069 Briarcliff Rd
- 179 N Ivy Ave
- 257 Aspen Dr
- 228 Oaks Ave
- 537 Cloverleaf Dr
- 1091 Briarcliff Rd
- 137 N Myrtle Ave
- 976 Ridgeside Dr
- 113 N Ivy Ave Unit 113 & 115
- 419 N Encinitas Ave
- 427 N Encinitas Ave
- 431 N Encinitas Ave
- 415 N Encinitas Ave
- 424 N Myrtle Ave
- 422 N Myrtle Ave
- 428 N Myrtle Ave
- 432 N Myrtle Ave
- 418 N Encinitas Ave
- 418 N Myrtle Ave
- 439 N Encinitas Ave
- 436 N Myrtle Ave
- 115 E Hillcrest Blvd
- 138 Seymour Place
- 432 N Encinitas Ave
- 440 N Myrtle Ave
- 127 E Hillcrest Blvd
- 443 N Encinitas Ave
- 109 E Hillcrest Blvd
- 440 N Encinitas Ave
Your Personal Tour Guide
Ask me questions while you tour the home.