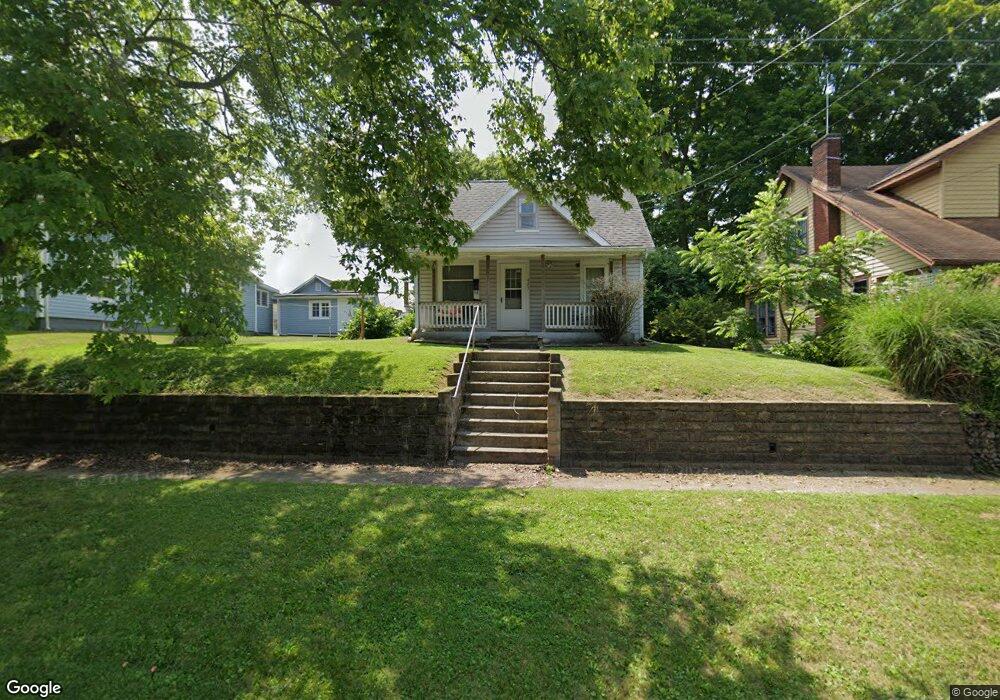
423 N Union St Loudonville, OH 44842
Estimated Value: $160,374 - $175,000
4
Beds
1
Bath
1,450
Sq Ft
$117/Sq Ft
Est. Value
About This Home
This home is located at 423 N Union St, Loudonville, OH 44842 and is currently estimated at $170,094, approximately $117 per square foot. 423 N Union St is a home located in Ashland County with nearby schools including McMullen Elementary School, Budd Elementary School, and Loudonville High School.
Ownership History
Date
Name
Owned For
Owner Type
Purchase Details
Closed on
Nov 1, 2006
Bought by
Hinkle Connie M
Current Estimated Value
Purchase Details
Closed on
Aug 28, 2006
Sold by
Hinkle Robert K
Purchase Details
Closed on
Jan 1, 1990
Bought by
Hinkle Robert K
Create a Home Valuation Report for This Property
The Home Valuation Report is an in-depth analysis detailing your home's value as well as a comparison with similar homes in the area
Home Values in the Area
Average Home Value in this Area
Purchase History
| Date | Buyer | Sale Price | Title Company |
|---|---|---|---|
| Hinkle Connie M | -- | -- | |
| -- | -- | -- | |
| Hinkle Robert K | -- | -- |
Source: Public Records
Tax History Compared to Growth
Tax History
| Year | Tax Paid | Tax Assessment Tax Assessment Total Assessment is a certain percentage of the fair market value that is determined by local assessors to be the total taxable value of land and additions on the property. | Land | Improvement |
|---|---|---|---|---|
| 2024 | $1,140 | $39,120 | $5,680 | $33,440 |
| 2023 | $1,140 | $39,120 | $5,680 | $33,440 |
| 2022 | $811 | $26,980 | $3,920 | $23,060 |
| 2021 | $823 | $26,980 | $3,920 | $23,060 |
| 2020 | $775 | $26,980 | $3,920 | $23,060 |
| 2019 | $706 | $25,000 | $4,010 | $20,990 |
| 2018 | $1,090 | $25,000 | $4,010 | $20,990 |
| 2017 | $580 | $25,000 | $4,010 | $20,990 |
| 2016 | $580 | $22,120 | $3,550 | $18,570 |
| 2015 | $576 | $22,120 | $3,550 | $18,570 |
| 2013 | $990 | $23,050 | $3,610 | $19,440 |
Source: Public Records
Map
Nearby Homes
- 316 E Campbell St
- 524 N Union St
- 333 E Campbell St
- 526 E Campbell St
- 500 Stone Meadow Cir
- 518 Snyder Dr
- 723 Pearl Dr
- 513 N Mount Vernon Ave
- 1406 Pearl Dr
- 2818 Township Road 2812
- 3183 County Road 3175
- 6620 Township Road 451
- 0 County Road 917
- 6913 County Road 22
- 3317 Township Road 539
- 136 Bridge St
- 14602 Township Road 469
- 14355 Township Road 467
- 609 Ohio 95
- 7129 Township Road 466