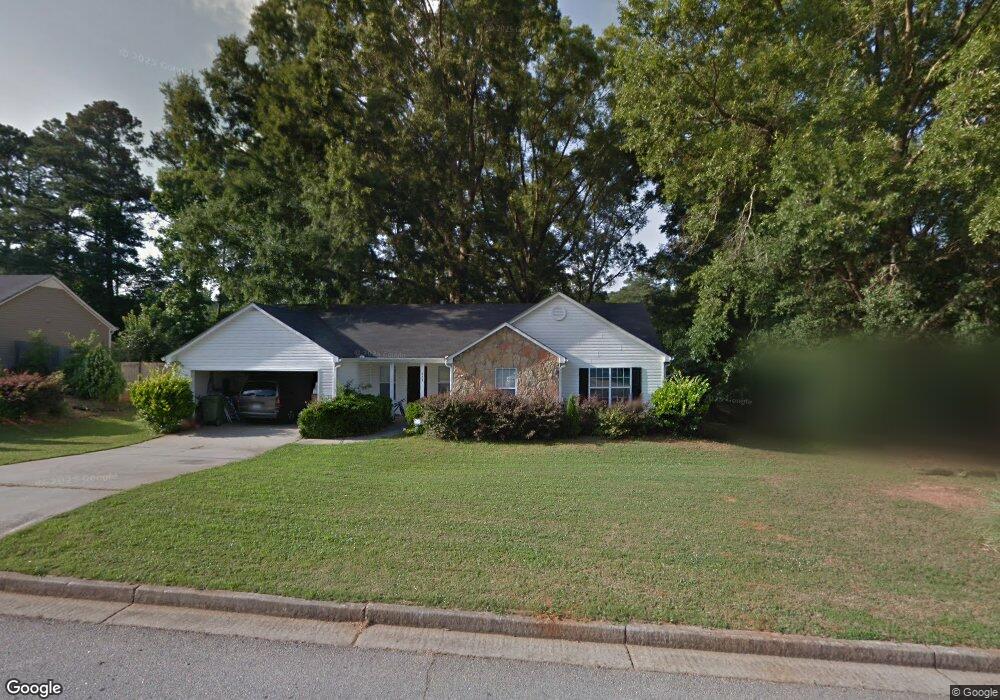
423 Red Oak Ct Monroe, GA 30655
Estimated Value: $253,819 - $349,000
Studio
--
Bath
1,270
Sq Ft
$224/Sq Ft
Est. Value
About This Home
This home is located at 423 Red Oak Ct, Monroe, GA 30655 and is currently estimated at $284,955, approximately $224 per square foot. 423 Red Oak Ct is a home located in Walton County with nearby schools including Atha Road Elementary School, Youth Middle School, and Walnut Grove High School.
Ownership History
Date
Name
Owned For
Owner Type
Purchase Details
Closed on
Jan 2, 2001
Sold by
Burris Elizabeth S
Bought by
Finger Grace S
Current Estimated Value
Home Financials for this Owner
Home Financials are based on the most recent Mortgage that was taken out on this home.
Original Mortgage
$15,000
Outstanding Balance
$5,530
Interest Rate
7.53%
Mortgage Type
New Conventional
Estimated Equity
$279,425
Purchase Details
Closed on
Nov 22, 2000
Sold by
Meridian Homes Of Ga
Bought by
Finger Grace S
Home Financials for this Owner
Home Financials are based on the most recent Mortgage that was taken out on this home.
Original Mortgage
$15,000
Outstanding Balance
$5,530
Interest Rate
7.53%
Mortgage Type
New Conventional
Estimated Equity
$279,425
Create a Home Valuation Report for This Property
The Home Valuation Report is an in-depth analysis detailing your home's value as well as a comparison with similar homes in the area
Home Values in the Area
Average Home Value in this Area
Purchase History
| Date | Buyer | Sale Price | Title Company |
|---|---|---|---|
| Finger Grace S | -- | -- | |
| Finger Grace S | $86,600 | -- |
Source: Public Records
Mortgage History
| Date | Status | Borrower | Loan Amount |
|---|---|---|---|
| Open | Finger Grace S | $15,000 |
Source: Public Records
Tax History
| Year | Tax Paid | Tax Assessment Tax Assessment Total Assessment is a certain percentage of the fair market value that is determined by local assessors to be the total taxable value of land and additions on the property. | Land | Improvement |
|---|---|---|---|---|
| 2025 | $1,131 | $108,360 | $20,000 | $88,360 |
| 2024 | $1,028 | $105,960 | $20,000 | $85,960 |
| 2023 | $975 | $100,880 | $18,000 | $82,880 |
| 2022 | $878 | $78,760 | $14,800 | $63,960 |
| 2021 | $778 | $61,560 | $11,200 | $50,360 |
| 2020 | $759 | $56,480 | $10,000 | $46,480 |
| 2019 | $702 | $43,120 | $8,000 | $35,120 |
| 2018 | $651 | $43,120 | $8,000 | $35,120 |
| 2017 | $1,618 | $38,600 | $6,000 | $32,600 |
| 2016 | $429 | $24,800 | $6,000 | $18,800 |
| 2015 | $408 | $23,440 | $6,000 | $17,440 |
| 2014 | -- | $22,080 | $6,000 | $16,080 |
Source: Public Records
Map
Nearby Homes
- 429 Red Oak Ct
- 404 Walker Dr
- 1435 Creek View Dr
- 316 Walker Dr
- 1004 Stone Creek Ln
- 1029 Stone Creek Ln
- 500 Mill Farm Ln
- 525 Mill Farm Ln
- 212 Walker Dr
- 529 Mill Farm Ln
- 206 Walker Dr
- 823 Legends Dr
- 724 Country Club Dr
- 808 S Broad St
- 227 Atha St
- 1328 S Madison Ave
- 1037 S Madison Ave
- 339 Flat Creek Dr
- 564 White Oak Way
- 16 Boxwood Ct
Your Personal Tour Guide
Ask me questions while you tour the home.