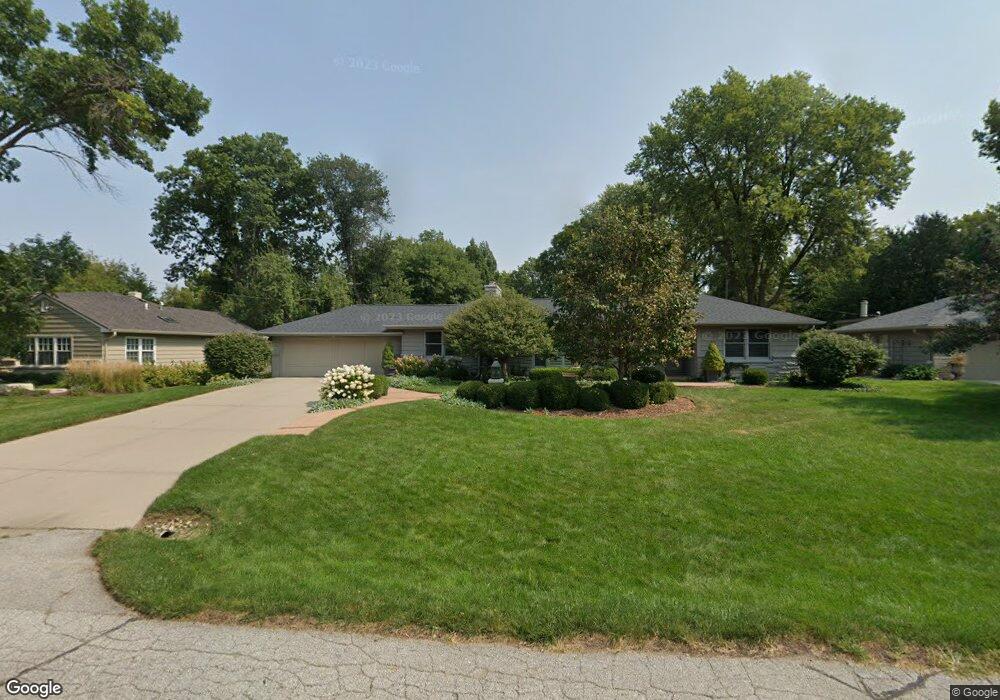
423 S 89th St Omaha, NE 68114
West Central Omaha NeighborhoodEstimated Value: $545,755 - $601,000
2
Beds
2
Baths
2,160
Sq Ft
$266/Sq Ft
Est. Value
About This Home
This home is located at 423 S 89th St, Omaha, NE 68114 and is currently estimated at $573,689, approximately $265 per square foot. 423 S 89th St is a home located in Douglas County with nearby schools including Carl A. Swanson Elementary School, Westside Middle School, and Westside High School.
Ownership History
Date
Name
Owned For
Owner Type
Purchase Details
Closed on
Jun 4, 2012
Sold by
Ambrose Frances C
Bought by
Kampfe John S and Kampfe Amy S
Current Estimated Value
Home Financials for this Owner
Home Financials are based on the most recent Mortgage that was taken out on this home.
Original Mortgage
$210,000
Outstanding Balance
$29,828
Interest Rate
3.9%
Mortgage Type
New Conventional
Estimated Equity
$543,861
Create a Home Valuation Report for This Property
The Home Valuation Report is an in-depth analysis detailing your home's value as well as a comparison with similar homes in the area
Home Values in the Area
Average Home Value in this Area
Purchase History
| Date | Buyer | Sale Price | Title Company |
|---|---|---|---|
| Kampfe John S | $265,000 | Titlecore Llc |
Source: Public Records
Mortgage History
| Date | Status | Borrower | Loan Amount |
|---|---|---|---|
| Open | Kampfe John S | $210,000 |
Source: Public Records
Tax History Compared to Growth
Tax History
| Year | Tax Paid | Tax Assessment Tax Assessment Total Assessment is a certain percentage of the fair market value that is determined by local assessors to be the total taxable value of land and additions on the property. | Land | Improvement |
|---|---|---|---|---|
| 2025 | $7,128 | $443,700 | $99,800 | $343,900 |
| 2024 | $8,866 | $434,700 | $99,800 | $334,900 |
| 2023 | $8,866 | $434,700 | $99,800 | $334,900 |
| 2022 | $7,339 | $335,300 | $99,800 | $235,500 |
| 2021 | $7,439 | $335,300 | $99,800 | $235,500 |
| 2020 | $7,399 | $327,800 | $99,800 | $228,000 |
| 2019 | $7,484 | $327,800 | $99,800 | $228,000 |
| 2018 | $6,758 | $295,100 | $99,800 | $195,300 |
| 2017 | $6,434 | $287,400 | $99,800 | $187,600 |
| 2016 | $5,429 | $243,900 | $56,200 | $187,700 |
| 2015 | $5,687 | $227,900 | $52,500 | $175,400 |
| 2014 | $5,687 | $259,300 | $52,500 | $206,800 |
Source: Public Records
Map
Nearby Homes
- 437 S 90th St
- 642 S 90th St
- 702 S 90th St
- 1015 S 90th Ct
- 660 S 85th St
- 307 S 93rd Ave
- 8646 Loveland Estates Ct
- 8633 Loveland Estates Ct
- 8643 Loveland Estates Ct
- 8629 Loveland Estates Ct
- 8614 Loveland Estates Ct
- 600 Ridgewood Ave
- 1135 S 87th St
- 1056 S 93rd Ct
- 1052 S 93rd Ct
- 1064 S 93rd Ct
- 1063 S 93rd Ct
- 1068 S 93rd Ct
- 1051 S 93rd Ct
- 1059 S 93rd Ct