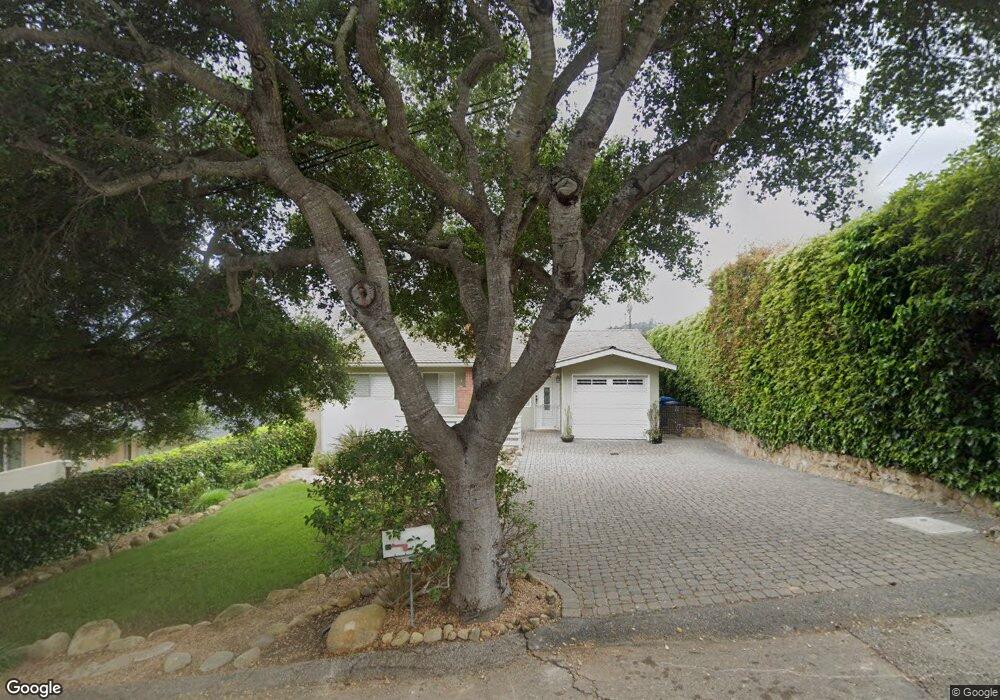
423 Seaview Rd Santa Barbara, CA 93108
Estimated Value: $1,866,368 - $4,046,000
3
Beds
2
Baths
1,104
Sq Ft
$2,649/Sq Ft
Est. Value
About This Home
This home is located at 423 Seaview Rd, Santa Barbara, CA 93108 and is currently estimated at $2,924,123, approximately $2,648 per square foot. 423 Seaview Rd is a home located in Santa Barbara County with nearby schools including Santa Barbara Junior High School, Santa Barbara Senior High School, and Adelante Charter School.
Ownership History
Date
Name
Owned For
Owner Type
Purchase Details
Closed on
May 3, 2004
Sold by
Napolitano Leo J and Napolitano Linda
Bought by
Napolitano Leo J and Napolitano Linda
Current Estimated Value
Home Financials for this Owner
Home Financials are based on the most recent Mortgage that was taken out on this home.
Original Mortgage
$333,000
Interest Rate
5.38%
Mortgage Type
New Conventional
Purchase Details
Closed on
Nov 11, 1998
Sold by
Napolitano Leo J and Napolitano Linda M
Bought by
Napolitano Leo J and Napolitano Linda
Home Financials for this Owner
Home Financials are based on the most recent Mortgage that was taken out on this home.
Original Mortgage
$227,150
Interest Rate
6.42%
Purchase Details
Closed on
Apr 22, 1996
Sold by
Napolitano Leo J and Napolitano Linda M
Bought by
Napolitano Leo J and Napolitano Linda
Create a Home Valuation Report for This Property
The Home Valuation Report is an in-depth analysis detailing your home's value as well as a comparison with similar homes in the area
Home Values in the Area
Average Home Value in this Area
Purchase History
| Date | Buyer | Sale Price | Title Company |
|---|---|---|---|
| Napolitano Leo J | -- | -- | |
| Napolitano Leo J | -- | Fidelity National Title Co | |
| Napolitano Leo J | -- | Chicago Title | |
| Napolitano Leo J | -- | Chicago Title | |
| Napolitano Leo J | -- | -- |
Source: Public Records
Mortgage History
| Date | Status | Borrower | Loan Amount |
|---|---|---|---|
| Closed | Napolitano Leo J | $333,000 | |
| Closed | Napolitano Leo J | $227,150 |
Source: Public Records
Tax History Compared to Growth
Tax History
| Year | Tax Paid | Tax Assessment Tax Assessment Total Assessment is a certain percentage of the fair market value that is determined by local assessors to be the total taxable value of land and additions on the property. | Land | Improvement |
|---|---|---|---|---|
| 2025 | $4,054 | $245,708 | $118,437 | $127,271 |
| 2023 | $4,054 | $236,169 | $113,839 | $122,330 |
| 2022 | $3,967 | $231,539 | $111,607 | $119,932 |
| 2021 | $3,913 | $227,000 | $109,419 | $117,581 |
| 2020 | $3,890 | $224,674 | $108,298 | $116,376 |
| 2019 | $3,821 | $220,270 | $106,175 | $114,095 |
| 2018 | $3,776 | $215,952 | $104,094 | $111,858 |
| 2017 | $3,637 | $211,718 | $102,053 | $109,665 |
| 2016 | $3,515 | $207,567 | $100,052 | $107,515 |
| 2015 | $3,287 | $204,451 | $98,550 | $105,901 |
| 2014 | -- | $200,447 | $96,620 | $103,827 |
Source: Public Records
Map
Nearby Homes
- 1567 E Valley Rd
- 1445 School House Rd
- 1399 School House Rd
- 240 Miramar Ave
- 1381 E Valley Rd
- 650 San Ysidro Rd
- 601 San Ysidro Rd
- 1520 Willina Ln
- 1725 E Valley Rd
- 485 Monarch Ln
- 454 Meadowbrook Dr
- 135 Pomar Ln
- 1850 Jelinda Dr
- 2925 Sycamore Canyon Rd
- 184 Tiburon Bay Ln
- 1630 N Jameson Ln
- 2775 Sycamore Canyon Rd
- 2749 Sycamore Canyon Rd
- 421 Seaview Rd
- 427 Seaview Rd
- 421 Seaview Rd
- 419 Seaview Rd
- 435 Seaview Rd
- 434 Lemon Grove Ln
- 422 Lemon Grove Ln
- 430 Seaview Rd
- 434 Seaview Rd
- 424 Seaview Rd
- 417 Seaview Rd
- 437 Seaview Rd
- 418 Lemon Grove Ln
- 436 Seaview Rd
- 420 Seaview Rd
- 442 Lemon Grove Ln
- 438 Seaview Rd
- 438 Sea View Rd
- 418 Seaview Rd
- 412 Lemon Grove Ln