423 W 9th St Newton, NC 28658
Estimated Value: $279,000 - $322,000
3
Beds
1
Bath
1,734
Sq Ft
$168/Sq Ft
Est. Value
About This Home
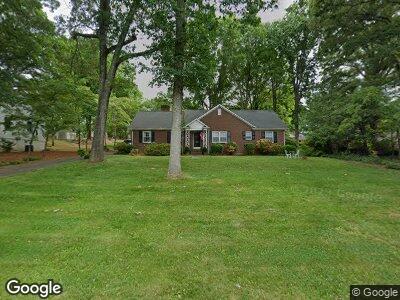
This home is located at 423 W 9th St, Newton, NC 28658 and is currently estimated at $290,801, approximately $167 per square foot. 423 W 9th St is a home located in Catawba County with nearby schools including South Newton Elementary School, Newton-Conover Middle School, and Newton-Conover High School.
Ownership History
Date
Name
Owned For
Owner Type
Purchase Details
Closed on
Apr 4, 2007
Sold by
Rhyne Myra L and Rhyne Myra Lutz
Bought by
Kelley Jeffrey L
Current Estimated Value
Home Financials for this Owner
Home Financials are based on the most recent Mortgage that was taken out on this home.
Original Mortgage
$135,000
Interest Rate
6.1%
Mortgage Type
Purchase Money Mortgage
Create a Home Valuation Report for This Property
The Home Valuation Report is an in-depth analysis detailing your home's value as well as a comparison with similar homes in the area
Home Values in the Area
Average Home Value in this Area
Purchase History
| Date | Buyer | Sale Price | Title Company |
|---|---|---|---|
| Kelley Jeffrey L | $150,000 | None Available |
Source: Public Records
Mortgage History
| Date | Status | Borrower | Loan Amount |
|---|---|---|---|
| Open | Kelley Jeffrey L | $124,500 | |
| Closed | Kelley Jeffrey L | $36,000 | |
| Closed | Kelley Jeffrey Lynn | $134,500 | |
| Closed | Kelley Jeffrey L | $135,000 |
Source: Public Records
Tax History Compared to Growth
Tax History
| Year | Tax Paid | Tax Assessment Tax Assessment Total Assessment is a certain percentage of the fair market value that is determined by local assessors to be the total taxable value of land and additions on the property. | Land | Improvement |
|---|---|---|---|---|
| 2024 | $2,064 | $243,200 | $27,100 | $216,100 |
| 2023 | $2,064 | $243,200 | $27,100 | $216,100 |
| 2022 | $1,763 | $158,100 | $21,500 | $136,600 |
| 2021 | $1,763 | $158,100 | $21,500 | $136,600 |
| 2020 | $1,763 | $158,100 | $21,500 | $136,600 |
| 2019 | $1,763 | $158,100 | $0 | $0 |
| 2018 | $1,570 | $140,800 | $21,000 | $119,800 |
| 2017 | $1,570 | $0 | $0 | $0 |
| 2016 | $1,570 | $0 | $0 | $0 |
| 2015 | $1,508 | $140,800 | $21,000 | $119,800 |
| 2014 | $1,508 | $149,300 | $22,100 | $127,200 |
Source: Public Records
Map
Nearby Homes