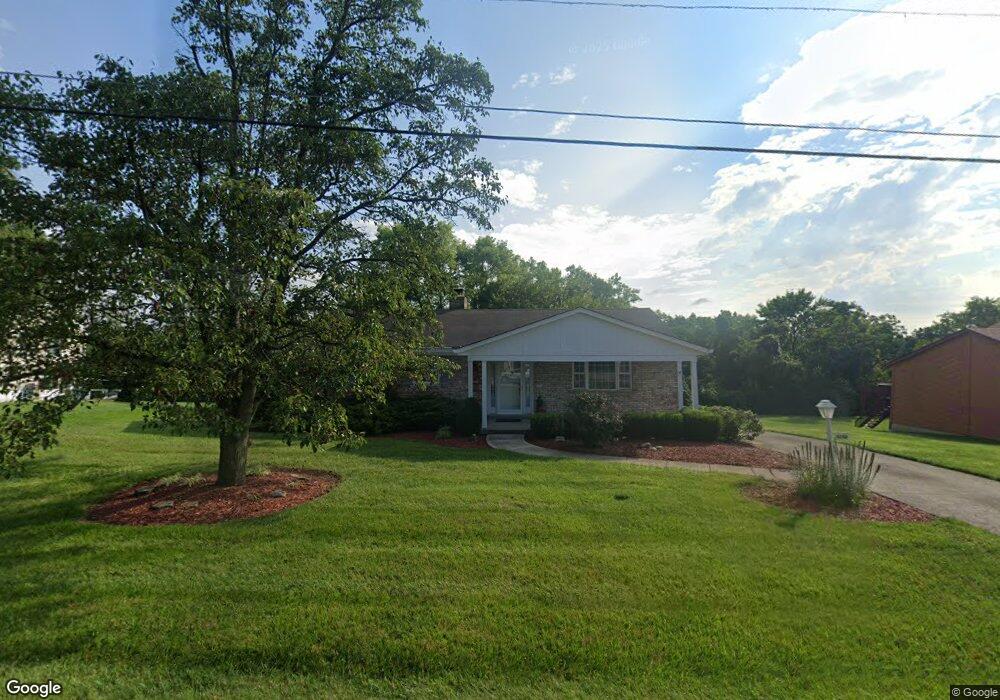
4230 Marcrest Dr Cincinnati, OH 45211
Estimated Value: $293,000 - $330,000
3
Beds
3
Baths
1,584
Sq Ft
$193/Sq Ft
Est. Value
About This Home
This home is located at 4230 Marcrest Dr, Cincinnati, OH 45211 and is currently estimated at $306,240, approximately $193 per square foot. 4230 Marcrest Dr is a home located in Hamilton County with nearby schools including Oakdale Elementary School, Bridgetown Middle School, and Oak Hills High School.
Ownership History
Date
Name
Owned For
Owner Type
Purchase Details
Closed on
Aug 11, 2023
Sold by
Joseph H Day And Ruth A Day Trust
Bought by
Albers Ryan Joseph and Cooley Casey E
Current Estimated Value
Home Financials for this Owner
Home Financials are based on the most recent Mortgage that was taken out on this home.
Original Mortgage
$212,000
Outstanding Balance
$206,226
Interest Rate
6.71%
Mortgage Type
New Conventional
Estimated Equity
$100,014
Purchase Details
Closed on
Feb 15, 2013
Sold by
Day Joseph H and Day Ruth A
Bought by
Day Joseph H and Day Ruth A
Purchase Details
Closed on
Apr 12, 1999
Sold by
Garrison Joyce A and Stewart Joyce A
Bought by
Singleton Danny and Denine Stacie
Home Financials for this Owner
Home Financials are based on the most recent Mortgage that was taken out on this home.
Original Mortgage
$54,114
Interest Rate
7.1%
Create a Home Valuation Report for This Property
The Home Valuation Report is an in-depth analysis detailing your home's value as well as a comparison with similar homes in the area
Home Values in the Area
Average Home Value in this Area
Purchase History
| Date | Buyer | Sale Price | Title Company |
|---|---|---|---|
| Albers Ryan Joseph | $265,000 | Millennial Title | |
| Day Joseph H | -- | Attorney | |
| Singleton Danny | $57,000 | Express Title Services Of Oh |
Source: Public Records
Mortgage History
| Date | Status | Borrower | Loan Amount |
|---|---|---|---|
| Open | Albers Ryan Joseph | $212,000 | |
| Previous Owner | Singleton Danny | $54,114 |
Source: Public Records
Tax History
| Year | Tax Paid | Tax Assessment Tax Assessment Total Assessment is a certain percentage of the fair market value that is determined by local assessors to be the total taxable value of land and additions on the property. | Land | Improvement |
|---|---|---|---|---|
| 2025 | $4,273 | $82,016 | $17,122 | $64,894 |
| 2024 | $4,167 | $82,016 | $17,122 | $64,894 |
| 2023 | $3,701 | $82,016 | $17,122 | $64,894 |
| 2022 | $3,267 | $63,238 | $16,646 | $46,592 |
| 2021 | $2,924 | $63,238 | $16,646 | $46,592 |
| 2020 | $2,974 | $63,238 | $16,646 | $46,592 |
| 2019 | $2,851 | $56,462 | $14,861 | $41,601 |
| 2018 | $2,856 | $56,462 | $14,861 | $41,601 |
| 2017 | $2,686 | $56,462 | $14,861 | $41,601 |
| 2016 | $2,542 | $53,939 | $14,714 | $39,225 |
| 2015 | $2,571 | $53,939 | $14,714 | $39,225 |
| 2014 | $2,575 | $53,939 | $14,714 | $39,225 |
| 2013 | $2,435 | $54,481 | $14,861 | $39,620 |
Source: Public Records
Map
Nearby Homes
- 4354 Oakville Dr
- 4324 Marcrest Dr
- 5175 Rowan Dr
- 4290 Race Rd
- 5236 Ivy Rose Ln
- 3911 Robinhill Dr
- 5225 Ivy Rose Ln
- 4213 Victorian Green Dr
- 4575 Boomer Rd
- 5165 Rowan Dr
- 4442 Homelawn Ave
- 4201 Boomer Rd
- 3743 Centurion Dr
- 3936 Janett Ave
- 3962 School Section Rd
- 4023 Washington Ave
- 3670 Centurion Dr
- 3632 Crestnoll Ln
- 4105 Trevor Ave
- 4104 Trevor Ave
- 4236 Marcrest Dr
- 4224 Marcrest Dr
- 4235 Marcrest Dr
- 4229 Marcrest Dr
- 4242 Marcrest Dr
- 4218 Marcrest Dr
- 4223 Marcrest Dr
- 4239 Marcrest Dr
- 4245 Marcrest Dr
- 4254 Marcrest Dr
- 4219 Marcrest Dr
- 4212 Marcrest Dr
- 4253 Marcrest Dr
- 4211 Marcrest Dr
- 4645 School Section Rd
- 4627 School Section Rd
- 4205 Marcrest Dr
- 4661 School Section Rd
- 4611 School Section Rd
- 4597 School Section Rd
Your Personal Tour Guide
Ask me questions while you tour the home.