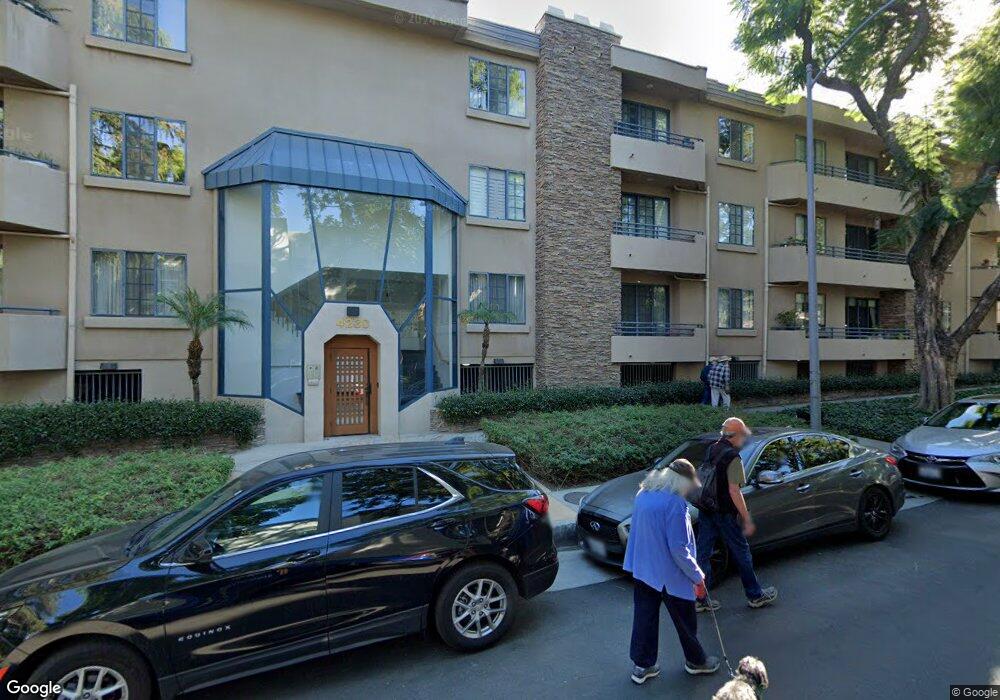
4230 Stansbury Ave Unit 101 Sherman Oaks, CA 91423
Estimated Value: $814,000 - $932,000
2
Beds
2
Baths
1,764
Sq Ft
$480/Sq Ft
Est. Value
About This Home
This home is located at 4230 Stansbury Ave Unit 101, Sherman Oaks, CA 91423 and is currently estimated at $846,772, approximately $480 per square foot. 4230 Stansbury Ave Unit 101 is a home located in Los Angeles County with nearby schools including Ulysses S. Grant Senior High School, Dixie Canyon Avenue Elementary School, and Sherman Oaks Elementary Charter School.
Ownership History
Date
Name
Owned For
Owner Type
Purchase Details
Closed on
Oct 2, 2017
Sold by
Araghi Delaram
Bought by
Agrahi Delaram and Dela Trust
Current Estimated Value
Purchase Details
Closed on
Aug 26, 2003
Sold by
Semsarzadeh Soudabeh
Bought by
Araghi Delaram
Purchase Details
Closed on
Dec 16, 1999
Sold by
Semsarzadeh Mohammad R
Bought by
Semsarzadeh Soudabeh
Purchase Details
Closed on
Aug 23, 1998
Sold by
Semsarzadeh Simin
Bought by
Semsarzadeh Soudabeh
Purchase Details
Closed on
Nov 23, 1993
Sold by
Garduno Rosemarie and Massa Rosemarie
Bought by
Semsarzadeh Mohammad Rahim
Purchase Details
Closed on
Nov 12, 1993
Sold by
Semsarzadeh Mohtaram Almolook
Bought by
Semsarzadeh Mohammad Rahim
Create a Home Valuation Report for This Property
The Home Valuation Report is an in-depth analysis detailing your home's value as well as a comparison with similar homes in the area
Home Values in the Area
Average Home Value in this Area
Purchase History
| Date | Buyer | Sale Price | Title Company |
|---|---|---|---|
| Agrahi Delaram | -- | None Available | |
| Araghi Delaram | -- | -- | |
| Semsarzadeh Soudabeh | -- | -- | |
| Semsarzadeh Soudabeh | -- | -- | |
| Semsarzadeh Soudabeh | -- | -- | |
| Semsarzadeh Mohammad Rahim | $205,000 | Commonwealth Land Title | |
| Semsarzadeh Mohammad Rahim | -- | Commonwealth Land Title |
Source: Public Records
Tax History Compared to Growth
Tax History
| Year | Tax Paid | Tax Assessment Tax Assessment Total Assessment is a certain percentage of the fair market value that is determined by local assessors to be the total taxable value of land and additions on the property. | Land | Improvement |
|---|---|---|---|---|
| 2025 | $4,266 | $345,947 | $121,788 | $224,159 |
| 2024 | $4,266 | $339,164 | $119,400 | $219,764 |
| 2023 | $4,185 | $332,514 | $117,059 | $215,455 |
| 2022 | $3,990 | $325,995 | $114,764 | $211,231 |
| 2021 | $3,933 | $319,604 | $112,514 | $207,090 |
| 2019 | $3,815 | $310,127 | $109,178 | $200,949 |
| 2018 | $8,135 | $667,000 | $367,000 | $300,000 |
| 2016 | $3,527 | $292,243 | $102,883 | $189,360 |
| 2015 | $3,475 | $287,854 | $101,338 | $186,516 |
| 2014 | $3,490 | $282,216 | $99,353 | $182,863 |
Source: Public Records
Map
Nearby Homes
- 4230 Stansbury Ave Unit 105
- 14128 Dickens St
- 14106 Dickens St Unit 102
- 14100 Dickens St Unit 4
- 14101 Dickens St Unit 4
- 4273 Murietta Ave
- 14235 Greenleaf St
- 14234 Dickens St Unit 2
- 4148 Camino de la Cumbre
- 4219 Costello Ave
- 14151 Moorpark St
- 13948 Moorpark St Unit 4
- 14332 Dickens St Unit 10
- 14332 Dickens St Unit 20
- 4437 Calhoun Ave
- 4334 Colbath Ave Unit 304
- 4447 Calhoun Ave
- 13920 Moorpark St
- 4476 Calhoun Ave
- 4500 Calhoun Ave
- 4230 Stansbury Ave Unit 103
- 4230 Stansbury Ave Unit 102
- 4230 Stansbury Ave Unit 305
- 4230 Stansbury Ave Unit 304
- 4230 Stansbury Ave Unit 303
- 4230 Stansbury Ave Unit 302
- 4230 Stansbury Ave Unit 301
- 4230 Stansbury Ave Unit 205
- 4230 Stansbury Ave Unit 204
- 4230 Stansbury Ave Unit 203
- 4230 Stansbury Ave Unit 202
- 4230 Stansbury Ave Unit 201
- 4230 Stansbury Ave Unit 104
- 14122 Dickens St
- 14126 Dickens St
- 14124 Dickens St
- 14120 Dickens St
- 14106 Dickens St Unit 305
- 14106 Dickens St Unit 304
- 14106 Dickens St Unit 303