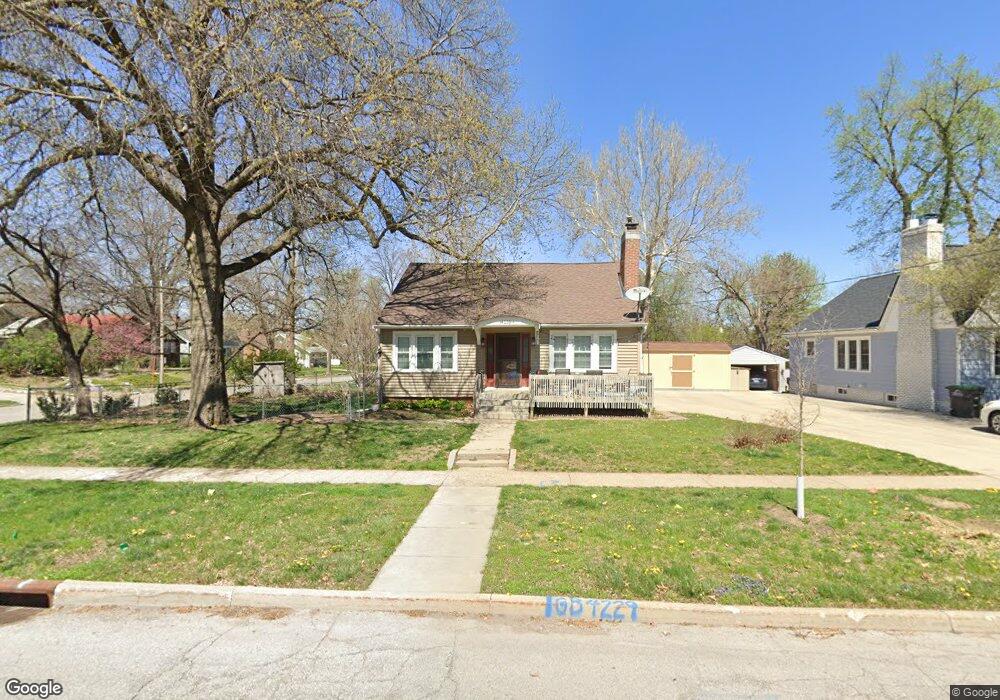
4231 Forest Ave Des Moines, IA 50311
Beaverdale NeighborhoodEstimated Value: $210,297 - $274,000
3
Beds
1
Bath
1,423
Sq Ft
$177/Sq Ft
Est. Value
About This Home
This home is located at 4231 Forest Ave, Des Moines, IA 50311 and is currently estimated at $251,824, approximately $176 per square foot. 4231 Forest Ave is a home located in Polk County with nearby schools including Perkins Elementary School, Merrill Middle School, and Roosevelt High School.
Ownership History
Date
Name
Owned For
Owner Type
Purchase Details
Closed on
Sep 10, 2003
Sold by
Heimbach John Steven and Heimbach Leslie M
Bought by
Mathews Robert J and Mathews Christine L
Current Estimated Value
Home Financials for this Owner
Home Financials are based on the most recent Mortgage that was taken out on this home.
Original Mortgage
$112,773
Outstanding Balance
$51,679
Interest Rate
6.18%
Mortgage Type
Purchase Money Mortgage
Estimated Equity
$200,145
Purchase Details
Closed on
Aug 28, 2000
Sold by
Heimbach John S and Heimbach Leslie M
Bought by
Mccullough Michael and Mccullough Mary
Create a Home Valuation Report for This Property
The Home Valuation Report is an in-depth analysis detailing your home's value as well as a comparison with similar homes in the area
Home Values in the Area
Average Home Value in this Area
Purchase History
| Date | Buyer | Sale Price | Title Company |
|---|---|---|---|
| Mathews Robert J | $114,500 | -- | |
| Mccullough Michael | $7,500 | -- |
Source: Public Records
Mortgage History
| Date | Status | Borrower | Loan Amount |
|---|---|---|---|
| Open | Mathews Robert J | $112,773 | |
| Closed | Mathews Robert J | $11,500 |
Source: Public Records
Tax History Compared to Growth
Tax History
| Year | Tax Paid | Tax Assessment Tax Assessment Total Assessment is a certain percentage of the fair market value that is determined by local assessors to be the total taxable value of land and additions on the property. | Land | Improvement |
|---|---|---|---|---|
| 2025 | $3,078 | $193,800 | $46,300 | $147,500 |
| 2024 | $3,078 | $173,000 | $41,100 | $131,900 |
| 2023 | $3,136 | $166,900 | $41,100 | $125,800 |
| 2022 | $3,110 | $141,900 | $36,300 | $105,600 |
| 2021 | $3,010 | $141,900 | $36,300 | $105,600 |
| 2020 | $3,122 | $129,200 | $33,100 | $96,100 |
| 2019 | $2,830 | $129,200 | $33,100 | $96,100 |
| 2018 | $2,796 | $113,800 | $29,000 | $84,800 |
| 2017 | $2,544 | $113,800 | $29,000 | $84,800 |
| 2016 | $2,474 | $102,600 | $26,000 | $76,600 |
| 2015 | $2,474 | $102,600 | $26,000 | $76,600 |
| 2014 | $2,156 | $93,100 | $23,500 | $69,600 |
Source: Public Records
Map
Nearby Homes