Estimated Value: $786,000 - $991,000
4
Beds
2
Baths
2,221
Sq Ft
$396/Sq Ft
Est. Value
About This Home
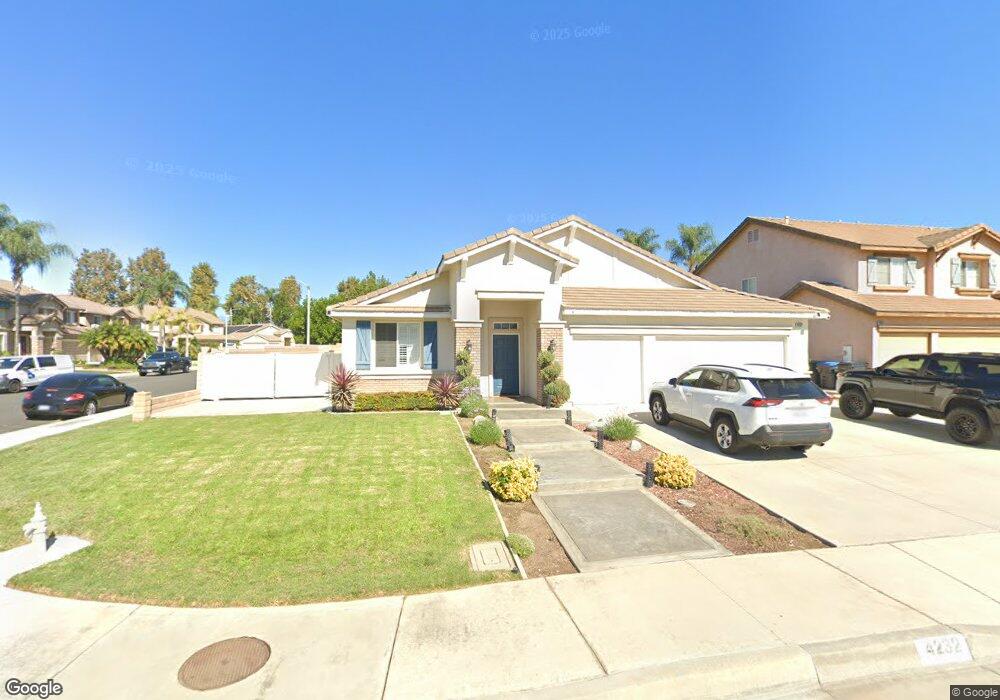
This home is located at 4232 Lombardy St, Chino, CA 91710 and is currently estimated at $879,848, approximately $396 per square foot. 4232 Lombardy St is a home located in San Bernardino County with nearby schools including Newman Elementary, Ramona Junior High School, and Don Antonio Lugo High School.
Ownership History
Date
Name
Owned For
Owner Type
Purchase Details
Closed on
Mar 12, 2021
Sold by
Castellanos Deborah Marie and Castellanos Deborah
Bought by
Castellanos Deborah Marie and Deborah Marie Castellanos Trus
Current Estimated Value
Purchase Details
Closed on
Dec 22, 2015
Sold by
Castellanos Ted A
Bought by
Castellanos Ted A and Castellanos Deborah
Home Financials for this Owner
Home Financials are based on the most recent Mortgage that was taken out on this home.
Original Mortgage
$237,000
Outstanding Balance
$99,217
Interest Rate
3.94%
Mortgage Type
New Conventional
Estimated Equity
$780,631
Purchase Details
Closed on
Oct 15, 1999
Sold by
Wl Homes Llc
Bought by
Castellanos Ted A and Castellanos Deborah V
Home Financials for this Owner
Home Financials are based on the most recent Mortgage that was taken out on this home.
Original Mortgage
$222,100
Interest Rate
7.69%
Create a Home Valuation Report for This Property
The Home Valuation Report is an in-depth analysis detailing your home's value as well as a comparison with similar homes in the area
Home Values in the Area
Average Home Value in this Area
Purchase History
| Date | Buyer | Sale Price | Title Company |
|---|---|---|---|
| Castellanos Deborah Marie | -- | None Available | |
| Castellanos Ted A | -- | Spl Title Services | |
| Castellanos Ted A | $234,000 | Chicago Title |
Source: Public Records
Mortgage History
| Date | Status | Borrower | Loan Amount |
|---|---|---|---|
| Open | Castellanos Ted A | $237,000 | |
| Previous Owner | Castellanos Ted A | $222,100 |
Source: Public Records
Tax History
| Year | Tax Paid | Tax Assessment Tax Assessment Total Assessment is a certain percentage of the fair market value that is determined by local assessors to be the total taxable value of land and additions on the property. | Land | Improvement |
|---|---|---|---|---|
| 2025 | $4,464 | $396,484 | $116,813 | $279,671 |
| 2024 | $4,347 | $388,710 | $114,523 | $274,187 |
| 2023 | $4,229 | $381,088 | $112,277 | $268,811 |
| 2022 | $4,203 | $373,615 | $110,075 | $263,540 |
| 2021 | $4,122 | $366,290 | $107,917 | $258,373 |
| 2020 | $4,069 | $362,534 | $106,810 | $255,724 |
| 2019 | $4,076 | $355,426 | $104,716 | $250,710 |
| 2018 | $3,629 | $315,807 | $102,663 | $213,144 |
| 2017 | $3,566 | $309,615 | $100,650 | $208,965 |
| 2016 | $3,265 | $303,544 | $98,676 | $204,868 |
| 2015 | $3,199 | $298,985 | $97,194 | $201,791 |
| 2014 | $3,137 | $293,128 | $95,290 | $197,838 |
Source: Public Records
Map
Nearby Homes
- 4258 Wintress Dr
- 4400 Philadelphia St Unit 71
- 4152 Kennedy Ct
- 4610 Philadelphia St
- 11814 Ramona Ave
- 4203 Francis Ave
- 12608 Ramona Ave
- 11938 Vista Ave
- 11818 Yorba Ave
- 3709 Kern Rd
- 3843 Francis Ave
- 12620 Anthony Place
- 4623 Granville St
- 11910 Carlisle Ave
- 12629 Thomas Place
- 4663 Granville St
- 4836 Terry Ave
- 11610 Sherwood Place
- 4610 Avondale Ct
- 4965 Independence St
- 4242 Lombardy St
- 4233 Bryant St
- 4243 Bryant St
- 12160 Orgren Ave Unit 280
- 4253 Bryant St
- 12140 Orgren Ave
- 4231 Lombardy St
- 4262 Lombardy St
- 4241 Lombardy St
- 4221 Lombardy St
- 12130 Orgren Ave
- 4263 Bryant St
- 12180 Orgren Ave
- 4251 Lombardy St
- 4272 Lombardy St
- 4261 Lombardy St
- 4273 Bryant St
- 12120 Orgren Ave
- 4230 Bryant St
- 4242 Wintress Dr
Your Personal Tour Guide
Ask me questions while you tour the home.