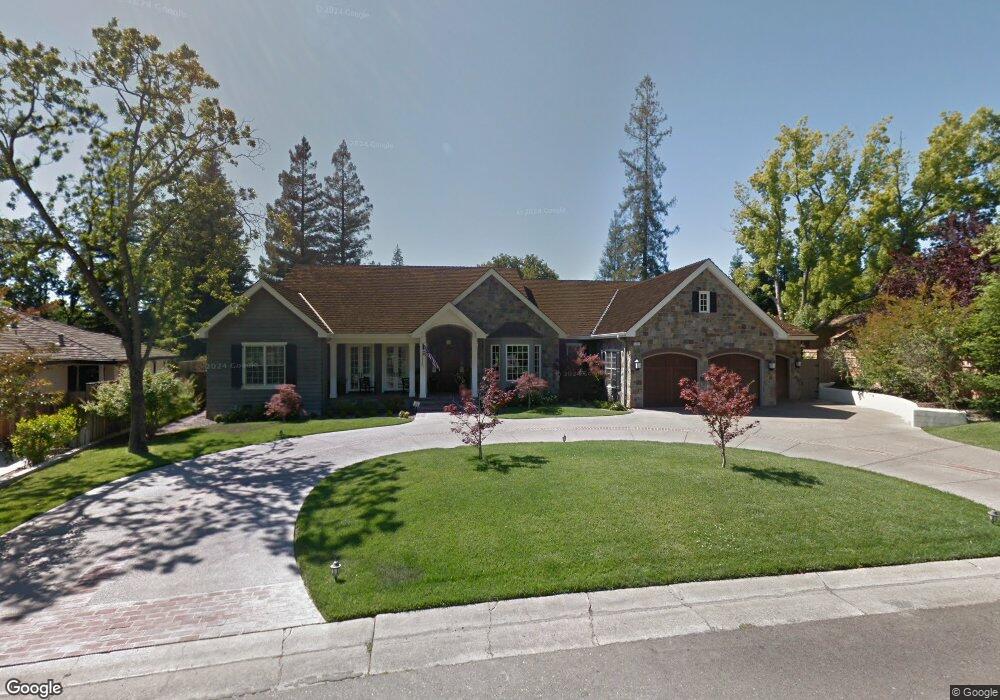
4233 Los Coches Way Sacramento, CA 95864
Arden Park NeighborhoodEstimated Value: $1,338,000 - $2,344,376
3
Beds
2
Baths
1,712
Sq Ft
$1,110/Sq Ft
Est. Value
About This Home
This home is located at 4233 Los Coches Way, Sacramento, CA 95864 and is currently estimated at $1,900,792, approximately $1,110 per square foot. 4233 Los Coches Way is a home located in Sacramento County with nearby schools including Mariemont Elementary School, Arden Middle School, and Rio Americano High School.
Ownership History
Date
Name
Owned For
Owner Type
Purchase Details
Closed on
Jun 14, 2021
Sold by
Siravo Patricia R
Bought by
Siravo Patricia R and The Siravo Family Trust
Current Estimated Value
Home Financials for this Owner
Home Financials are based on the most recent Mortgage that was taken out on this home.
Original Mortgage
$100,000
Outstanding Balance
$90,538
Interest Rate
2.9%
Mortgage Type
New Conventional
Estimated Equity
$1,810,254
Purchase Details
Closed on
Nov 2, 2010
Sold by
Siravo Robert A and Siravo Patricia R
Bought by
Siravo Robert A and Siravo Patricia R
Purchase Details
Closed on
May 31, 2010
Sold by
Hill John E and Hill Steven B
Bought by
Siravo Robert and Siravo Patricia
Purchase Details
Closed on
Jul 20, 2007
Sold by
Hill Hill June B June B and Hill John E
Bought by
Hill June B and John E & June B Hill Family Tr
Purchase Details
Closed on
Dec 20, 1994
Sold by
Hill John E and Hill June B
Bought by
Hill John E and Hill June B
Create a Home Valuation Report for This Property
The Home Valuation Report is an in-depth analysis detailing your home's value as well as a comparison with similar homes in the area
Home Values in the Area
Average Home Value in this Area
Purchase History
| Date | Buyer | Sale Price | Title Company |
|---|---|---|---|
| Siravo Patricia R | -- | Old Republic Title Company | |
| Siravo Patricia R | -- | Old Republic Title Company | |
| Siravo Robert A | -- | None Available | |
| Siravo Robert | $651,500 | Chicago Title Company | |
| Hill June B | -- | None Available | |
| Hill John E | -- | -- |
Source: Public Records
Mortgage History
| Date | Status | Borrower | Loan Amount |
|---|---|---|---|
| Open | Siravo Patricia R | $100,000 |
Source: Public Records
Tax History Compared to Growth
Tax History
| Year | Tax Paid | Tax Assessment Tax Assessment Total Assessment is a certain percentage of the fair market value that is determined by local assessors to be the total taxable value of land and additions on the property. | Land | Improvement |
|---|---|---|---|---|
| 2025 | $18,644 | $1,583,023 | $840,386 | $742,637 |
| 2024 | $18,644 | $1,551,984 | $823,908 | $728,076 |
| 2023 | $18,170 | $1,521,553 | $807,753 | $713,800 |
| 2022 | $18,074 | $1,491,719 | $791,915 | $699,804 |
| 2021 | $17,774 | $1,462,471 | $776,388 | $686,083 |
| 2020 | $17,442 | $1,447,477 | $768,428 | $679,049 |
| 2019 | $17,091 | $1,419,096 | $753,361 | $665,735 |
| 2018 | $16,884 | $1,391,272 | $738,590 | $652,682 |
| 2017 | $16,661 | $1,358,581 | $718,696 | $639,885 |
| 2016 | $14,651 | $1,253,732 | $461,901 | $791,831 |
| 2015 | $14,059 | $1,205,512 | $444,136 | $761,376 |
| 2014 | $13,631 | $1,170,400 | $431,200 | $739,200 |
Source: Public Records
Map
Nearby Homes
- 931 Los Molinos Way
- 4116 Puente Way
- 760 Cortlandt Dr
- 930 San Ramon Way
- 741 Estates Dr
- 650 Mystic Ln
- 4320 Rand Ln
- 1140 Castec Dr
- 670 Lake Wilhaggin Dr
- 1 Usfs 8bn54 Rd
- 4285 Alton Ct
- 612 Lake Wilhaggin Dr
- 631 Wilhaggin Dr
- 590 Kevington Ct
- 4609 Ashton Dr
- 3530 Bodega Ct
- 4611 Fair Oaks Blvd
- 3601 San Ysidro Way
- 3511 La Habra Way
- 4040 Cayente Way
- 4229 Los Coches Way
- 4237 Los Coches Way
- 1100 El Sur Way
- 1040 El Sur Way
- 1110 El Sur Way
- 4230 Los Coches Way
- 4225 Los Coches Way
- 4236 Los Coches Way
- 1030 El Sur Way
- 4130 Los Coches Way
- 4120 Los Coches Way
- 4224 Los Coches Way
- 4110 Los Coches Way
- 4242 Los Coches Way
- 4221 Los Coches Way
- 1020 El Sur Way
- 4100 Los Coches Way
- 4220 Los Coches Way
- 4150 Los Coches Way
- 1101 El Sur Way