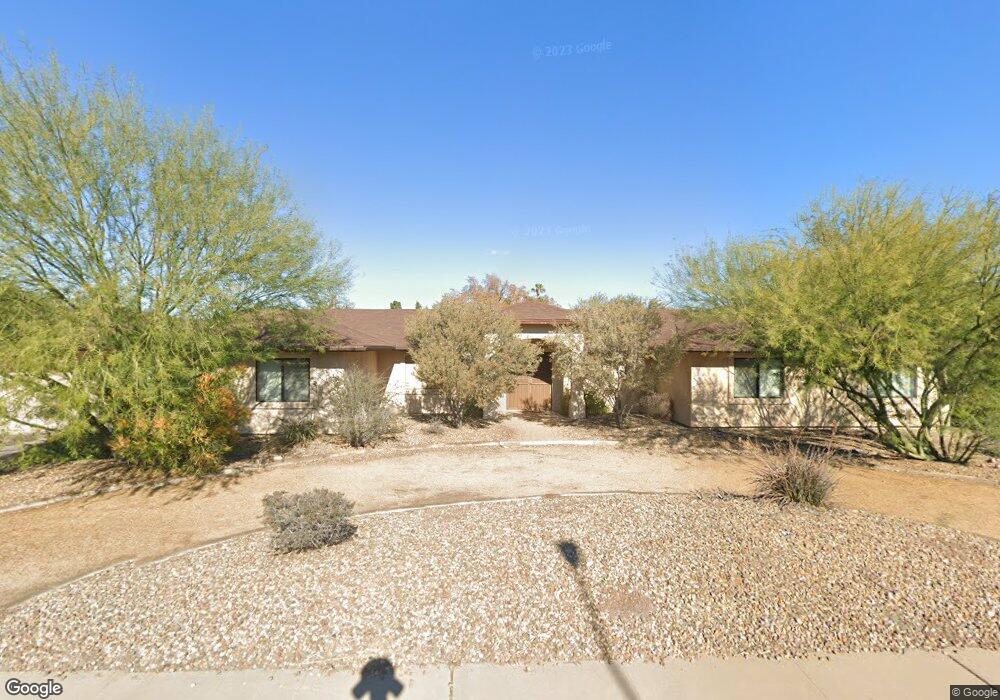
4234 E Shangri la Rd Phoenix, AZ 85028
Paradise Valley Village NeighborhoodEstimated Value: $795,000 - $1,322,962
5
Beds
3
Baths
3,643
Sq Ft
$310/Sq Ft
Est. Value
About This Home
This home is located at 4234 E Shangri la Rd, Phoenix, AZ 85028 and is currently estimated at $1,130,241, approximately $310 per square foot. 4234 E Shangri la Rd is a home located in Maricopa County with nearby schools including Sequoya Elementary School, Cocopah Middle School, and Chaparral High School.
Ownership History
Date
Name
Owned For
Owner Type
Purchase Details
Closed on
Apr 30, 2019
Sold by
Candy Market Llc
Bought by
Prime Zone Llc
Current Estimated Value
Purchase Details
Closed on
Jul 16, 2015
Sold by
Jpmorgan Chase Bank Na
Bought by
Candy Market Llc
Purchase Details
Closed on
Oct 31, 2014
Sold by
Gaynes Benton
Bought by
Jpmorgan Chase Bank Na
Purchase Details
Closed on
Oct 8, 2009
Sold by
Gaynes Benton and Davis Rebecca Sue
Bought by
Gaynes Benton and Davis Rebecca Sue
Purchase Details
Closed on
Mar 2, 2006
Sold by
Barr Mary B
Bought by
Gaynes Benton
Home Financials for this Owner
Home Financials are based on the most recent Mortgage that was taken out on this home.
Original Mortgage
$356,000
Interest Rate
5.9%
Mortgage Type
Purchase Money Mortgage
Purchase Details
Closed on
Jan 8, 2001
Sold by
Fleck Frank
Bought by
Fleck Mary B
Home Financials for this Owner
Home Financials are based on the most recent Mortgage that was taken out on this home.
Original Mortgage
$169,500
Interest Rate
6.98%
Create a Home Valuation Report for This Property
The Home Valuation Report is an in-depth analysis detailing your home's value as well as a comparison with similar homes in the area
Home Values in the Area
Average Home Value in this Area
Purchase History
| Date | Buyer | Sale Price | Title Company |
|---|---|---|---|
| Prime Zone Llc | -- | None Available | |
| Candy Market Llc | -- | Servicelink | |
| Jpmorgan Chase Bank Na | $426,000 | Accommodation | |
| Gaynes Benton | -- | None Available | |
| Gaynes Benton | $445,500 | Chicago Title Insurance Co | |
| Fleck Mary B | -- | Capital Title Agency |
Source: Public Records
Mortgage History
| Date | Status | Borrower | Loan Amount |
|---|---|---|---|
| Previous Owner | Gaynes Benton | $356,000 | |
| Previous Owner | Fleck Mary B | $169,500 |
Source: Public Records
Tax History
| Year | Tax Paid | Tax Assessment Tax Assessment Total Assessment is a certain percentage of the fair market value that is determined by local assessors to be the total taxable value of land and additions on the property. | Land | Improvement |
|---|---|---|---|---|
| 2025 | $4,253 | $51,775 | -- | -- |
| 2024 | $3,988 | $49,310 | -- | -- |
| 2023 | $3,988 | $75,800 | $15,160 | $60,640 |
| 2022 | $3,825 | $58,050 | $11,610 | $46,440 |
| 2021 | $3,964 | $55,020 | $11,000 | $44,020 |
| 2020 | $3,905 | $51,620 | $10,320 | $41,300 |
| 2019 | $3,759 | $47,470 | $9,490 | $37,980 |
| 2018 | $3,615 | $44,060 | $8,810 | $35,250 |
| 2017 | $3,473 | $44,660 | $8,930 | $35,730 |
| 2016 | $3,384 | $42,550 | $8,510 | $34,040 |
| 2015 | $3,102 | $40,680 | $8,130 | $32,550 |
Source: Public Records
Map
Nearby Homes
- 4224 E Desert Cove Ave
- 11002 N 45th St
- 4109 E Mercer Ln
- 11437 N 40th Place
- 10635 N 44th Ct
- 11615 N 40th Way
- 4053 E Sunnyside Dr
- 11625 N 40th Way
- 3941 E Cholla St
- 4001 E Becker Ln Unit 8
- 3929 E Mercer Ln
- 4028 E Sunnyside Dr
- 12212 N Paradise Village Pkwy S Unit 134
- 12212 N Paradise Village Pkwy S Unit 428
- 12212 N Paradise Village Pkwy S Unit 129
- 12212 N Paradise Village Pkwy S Unit 444
- 12212 N Paradise Village Pkwy S Unit 146
- 12212 N Paradise Village Pkwy S Unit 445
- 12212 N Paradise Village Pkwy S Unit 335
- 11837 N 40th Place
- 4242 E Shangri la Rd
- 4224 E Shangri la Rd
- 4233 E Yucca St
- 4223 E Yucca St
- 4233 E Shangri la Rd
- 4241 E Shangri la Rd
- 4252 E Shangri la Rd
- 4223 E Shangri la Rd
- 4241 E Yucca St
- 4251 E Shangri la Rd
- 11038 N 42nd Place
- 11048 N 42nd Place
- 4263 E Shangri la Rd
- 11028 N 42nd Place
- 4234 E Desert Cove Ave
- 4224 E Yucca St
- 4242 E Desert Cove Ave
- 4251 E Yucca St
- 4234 E Yucca St
- 4302 E Shangri la Rd
Your Personal Tour Guide
Ask me questions while you tour the home.