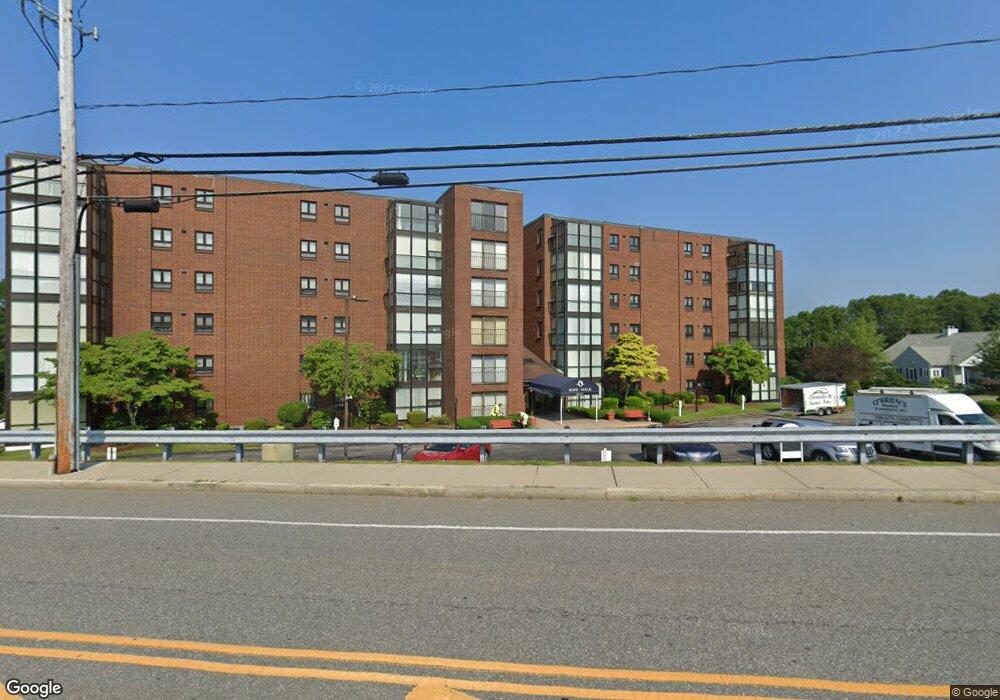
4234 N Main St Unit 5G1 Fall River, MA 02720
Western Fall River NeighborhoodEstimated Value: $353,565 - $398,000
2
Beds
3
Baths
1,232
Sq Ft
$308/Sq Ft
Est. Value
About This Home
This home is located at 4234 N Main St Unit 5G1, Fall River, MA 02720 and is currently estimated at $379,141, approximately $307 per square foot. 4234 N Main St Unit 5G1 is a home located in Bristol County with nearby schools including North End Elementary School, Morton Middle School, and B M C Durfee High School.
Ownership History
Date
Name
Owned For
Owner Type
Purchase Details
Closed on
Jan 7, 2022
Sold by
Rebello Milton J and Rebello Susan J
Bought by
Rebello Milton J
Current Estimated Value
Home Financials for this Owner
Home Financials are based on the most recent Mortgage that was taken out on this home.
Original Mortgage
$182,490
Outstanding Balance
$168,873
Interest Rate
3.11%
Mortgage Type
Stand Alone Refi Refinance Of Original Loan
Estimated Equity
$210,268
Purchase Details
Closed on
Sep 16, 2011
Sold by
Maureen F Kiley Ret and Kiley William F
Bought by
Rebello Milton J and Rebello Susan J
Home Financials for this Owner
Home Financials are based on the most recent Mortgage that was taken out on this home.
Original Mortgage
$100,000
Interest Rate
4.38%
Mortgage Type
Purchase Money Mortgage
Purchase Details
Closed on
Jul 28, 2006
Sold by
Jacques Bernadette
Bought by
Maureen F Kiley Ret and Kiley Maureen F
Purchase Details
Closed on
Apr 13, 1990
Sold by
Rope Walk Condo Inc
Bought by
Tanikawa Hanako
Create a Home Valuation Report for This Property
The Home Valuation Report is an in-depth analysis detailing your home's value as well as a comparison with similar homes in the area
Home Values in the Area
Average Home Value in this Area
Purchase History
| Date | Buyer | Sale Price | Title Company |
|---|---|---|---|
| Rebello Milton J | -- | None Available | |
| Rebello Milton J | $167,500 | -- | |
| Maureen F Kiley Ret | $245,000 | -- | |
| Tanikawa Hanako | $149,900 | -- |
Source: Public Records
Mortgage History
| Date | Status | Borrower | Loan Amount |
|---|---|---|---|
| Open | Rebello Milton J | $182,490 | |
| Previous Owner | Rebello Milton J | $100,000 |
Source: Public Records
Tax History Compared to Growth
Tax History
| Year | Tax Paid | Tax Assessment Tax Assessment Total Assessment is a certain percentage of the fair market value that is determined by local assessors to be the total taxable value of land and additions on the property. | Land | Improvement |
|---|---|---|---|---|
| 2025 | $3,114 | $272,000 | $0 | $272,000 |
| 2024 | $2,945 | $256,300 | $0 | $256,300 |
| 2023 | $3,265 | $266,100 | $0 | $266,100 |
| 2022 | $2,940 | $233,000 | $0 | $233,000 |
| 2021 | $3,417 | $247,100 | $0 | $247,100 |
| 2020 | $3,196 | $221,200 | $0 | $221,200 |
| 2019 | $2,932 | $201,100 | $0 | $201,100 |
| 2018 | $2,597 | $177,600 | $0 | $177,600 |
| 2017 | $2,318 | $165,600 | $0 | $165,600 |
| 2016 | $2,053 | $150,600 | $0 | $150,600 |
| 2015 | $1,919 | $146,700 | $0 | $146,700 |
| 2014 | $1,985 | $157,800 | $0 | $157,800 |
Source: Public Records
Map
Nearby Homes
- 4234 N Main St Unit 103
- 3896 N Main St
- 3682 N Main St Unit 7
- 120 Lewin St Unit 30
- 120 Terri Marie Way Unit 5-13
- 50 Clark St Unit 19
- 135 Grove Ave
- 2714 Riverside Ave
- 3226 N Main St Unit 1
- 3216 N Main St
- 81 Wood St
- 5455 N Main St Unit 14B
- 5455 N Main St Unit 12A
- 5455 N Main St Unit 18A
- 5455 N Main St Unit 17A
- 5455 N Main St Unit 13A
- 54 Grant Ave
- 2396 Riverside Ave
- 280 Joseph Dr
- 190 Gibbs St
- 4234 N Main St Unit 405
- 4234 N Main St Unit 35
- 4234 N Main St Unit R
- 4234 N Main St Unit 6G4
- 4234 N Main St Unit 6G3
- 4234 N Main St Unit 6G2
- 4234 N Main St Unit 6G1
- 4234 N Main St Unit 6A5
- 4234 N Main St Unit 6A4
- 4234 N Main St Unit 6A3
- 4234 N Main St Unit 6A2
- 4234 N Main St Unit 6A1
- 4234 N Main St Unit 6
- 4234 N Main St Unit 5G4
- 4234 N Main St Unit 5G3
- 4234 N Main St Unit 5G2
- 4234 N Main St Unit 5A5
- 4234 N Main St Unit 5A4
- 4234 N Main St Unit 5A3
- 4234 N Main St Unit 5A2