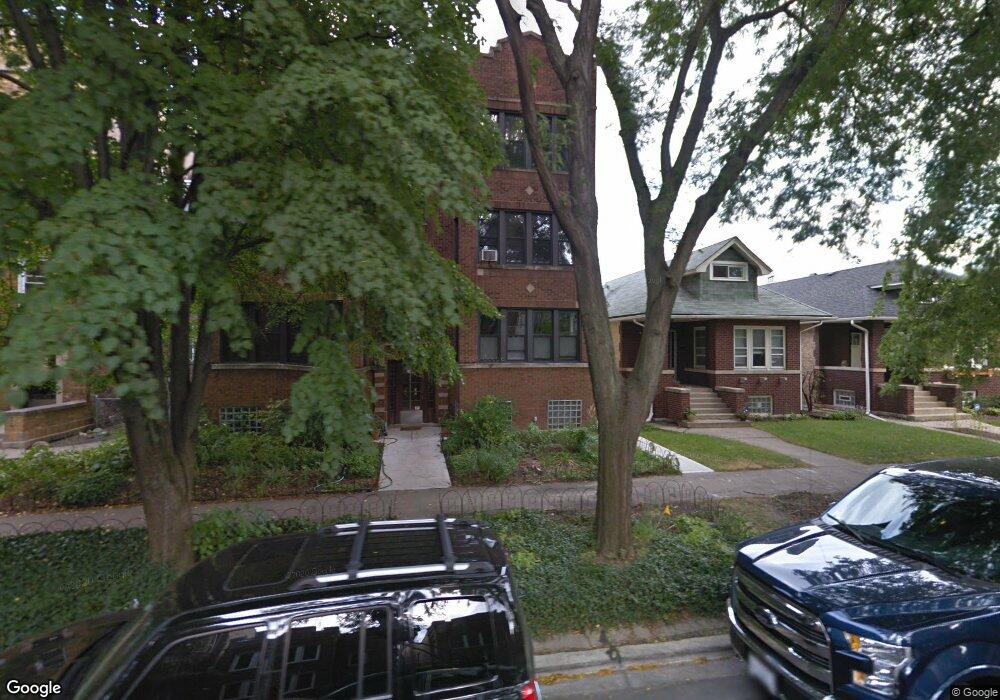
4235 N Mozart St Unit 3S Chicago, IL 60618
Irving Park NeighborhoodEstimated Value: $315,942 - $396,000
2
Beds
1
Bath
1,300
Sq Ft
$275/Sq Ft
Est. Value
About This Home
This home is located at 4235 N Mozart St Unit 3S, Chicago, IL 60618 and is currently estimated at $357,736, approximately $275 per square foot. 4235 N Mozart St Unit 3S is a home located in Cook County with nearby schools including Bateman Elementary School, Roosevelt High School, and Chicago Jewish Day School.
Ownership History
Date
Name
Owned For
Owner Type
Purchase Details
Closed on
Aug 8, 2011
Sold by
Conlon Camilla
Bought by
Lee Linda
Current Estimated Value
Home Financials for this Owner
Home Financials are based on the most recent Mortgage that was taken out on this home.
Original Mortgage
$125,600
Outstanding Balance
$87,045
Interest Rate
4.59%
Mortgage Type
New Conventional
Estimated Equity
$270,691
Purchase Details
Closed on
Nov 21, 2001
Sold by
Silvestri Christine and Silvestri Gregory
Bought by
Conlon Camilla
Home Financials for this Owner
Home Financials are based on the most recent Mortgage that was taken out on this home.
Original Mortgage
$152,000
Interest Rate
6.62%
Mortgage Type
Purchase Money Mortgage
Purchase Details
Closed on
Sep 21, 1998
Sold by
Kay Jason and Hertz Judith
Bought by
Benkowski Christine
Home Financials for this Owner
Home Financials are based on the most recent Mortgage that was taken out on this home.
Original Mortgage
$82,400
Interest Rate
6.8%
Create a Home Valuation Report for This Property
The Home Valuation Report is an in-depth analysis detailing your home's value as well as a comparison with similar homes in the area
Home Values in the Area
Average Home Value in this Area
Purchase History
| Date | Buyer | Sale Price | Title Company |
|---|---|---|---|
| Lee Linda | $157,000 | Fidelity National Title | |
| Conlon Camilla | $180,000 | Plm Title Company | |
| Benkowski Christine | $103,000 | -- |
Source: Public Records
Mortgage History
| Date | Status | Borrower | Loan Amount |
|---|---|---|---|
| Open | Lee Linda | $125,600 | |
| Previous Owner | Conlon Camilla | $152,000 | |
| Previous Owner | Benkowski Christine | $82,400 |
Source: Public Records
Tax History Compared to Growth
Tax History
| Year | Tax Paid | Tax Assessment Tax Assessment Total Assessment is a certain percentage of the fair market value that is determined by local assessors to be the total taxable value of land and additions on the property. | Land | Improvement |
|---|---|---|---|---|
| 2024 | $3,533 | $33,360 | $6,458 | $26,902 |
| 2023 | $3,422 | $20,000 | $5,208 | $14,792 |
| 2022 | $3,422 | $20,000 | $5,208 | $14,792 |
| 2021 | $3,363 | $19,999 | $5,208 | $14,791 |
| 2020 | $3,647 | $19,415 | $2,291 | $17,124 |
| 2019 | $3,667 | $21,619 | $2,291 | $19,328 |
| 2018 | $3,604 | $21,619 | $2,291 | $19,328 |
| 2017 | $2,578 | $15,313 | $2,083 | $13,230 |
| 2016 | $2,575 | $15,313 | $2,083 | $13,230 |
| 2015 | $2,334 | $15,313 | $2,083 | $13,230 |
| 2014 | $2,429 | $15,614 | $1,875 | $13,739 |
| 2013 | $2,370 | $15,614 | $1,875 | $13,739 |
Source: Public Records
Map
Nearby Homes
- 4251 N Mozart St Unit 2S
- 4251 N Mozart St Unit S2
- 4347 N Richmond St Unit 1N
- 4347 N Richmond St Unit 1S
- 4347 N Richmond St Unit 3N
- 4347 N Richmond St Unit 2N
- 4343 N Sacramento Ave Unit A-G
- 4020 N Francisco Ave
- 4425 N Sacramento Ave
- 2901 W Sunnyside Ave
- 3102 W Berteau Ave Unit 31023
- 4437 N Whipple St
- 4529 N Mozart St
- 4316 N Albany Ave Unit 1
- 2714 W Byron St
- 4307 N Troy St Unit 1
- 3929 N Francisco Ave
- 4333 N Troy St Unit 3E
- 3024 W Irving Park Rd Unit 1S
- 2468 W Berteau Ave
- 4235 N Mozart St Unit 2S
- 4235 N Mozart St Unit 1N
- 4235 N Mozart St Unit 1S
- 4237 N Mozart St Unit 2N
- 4237 N Mozart St Unit 3N
- 4233 N Mozart St
- 4241 N Mozart St
- 4229 N Mozart St
- 4245 N Mozart St Unit 2
- 4227 N Mozart St
- 4227 N Mozart St Unit 1F
- 4249 N Mozart St Unit 1
- 4223 N Mozart St
- 4238 N California Ave
- 4253 N Mozart St Unit 3N
- 4253 N Mozart St Unit 42533N
- 4253 N Mozart St Unit 42531N
- 4251 N Mozart St Unit 42511S
- 4253 N Mozart St Unit 42532N
- 4251 N Mozart St Unit 42513S