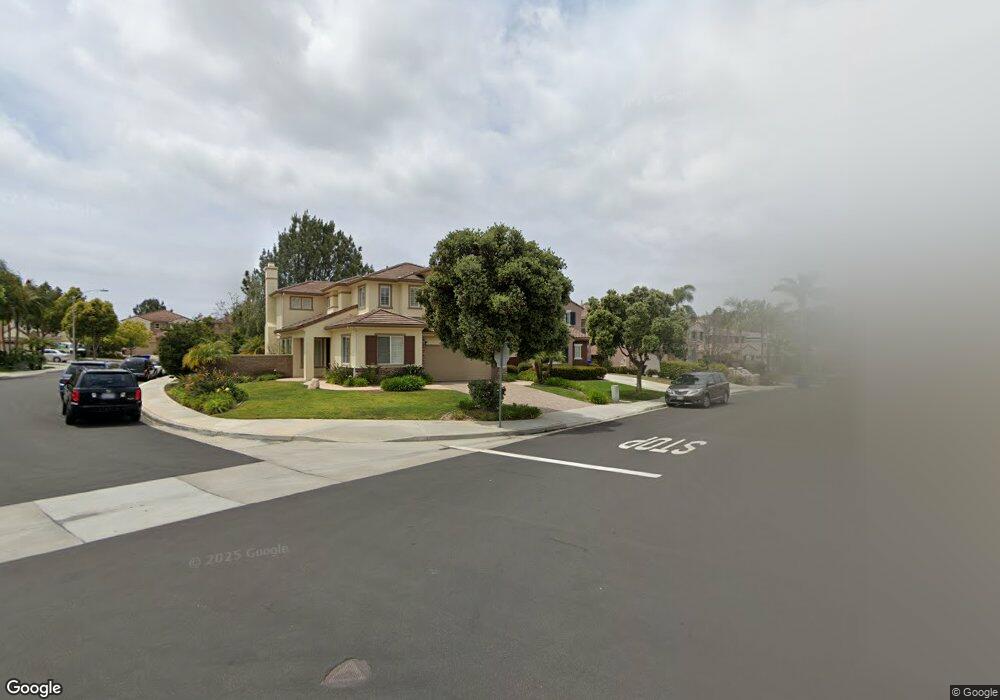
4235 Via Mar de Delfinas Unit 4 San Diego, CA 92130
Carmel Valley NeighborhoodEstimated Value: $2,163,000 - $2,534,000
5
Beds
3
Baths
2,827
Sq Ft
$827/Sq Ft
Est. Value
About This Home
This home is located at 4235 Via Mar de Delfinas Unit 4, San Diego, CA 92130 and is currently estimated at $2,336,837, approximately $826 per square foot. 4235 Via Mar de Delfinas Unit 4 is a home located in San Diego County with nearby schools including Carmel Valley Middle School, Torrey Hills High School, and Torrey Pines High School.
Ownership History
Date
Name
Owned For
Owner Type
Purchase Details
Closed on
Jun 18, 2012
Sold by
Shafer Steven G and Parma Susanna
Bought by
Shafer Steven G and Parma Susanna
Current Estimated Value
Purchase Details
Closed on
Aug 26, 2003
Sold by
Parma Susanna
Bought by
Shafer Steven G
Home Financials for this Owner
Home Financials are based on the most recent Mortgage that was taken out on this home.
Original Mortgage
$400,000
Interest Rate
5%
Mortgage Type
Purchase Money Mortgage
Purchase Details
Closed on
Sep 18, 1998
Sold by
Presley Torrey Ii Associates Llc
Bought by
Grieco Thomas J and Grieco Molly C
Home Financials for this Owner
Home Financials are based on the most recent Mortgage that was taken out on this home.
Original Mortgage
$318,211
Interest Rate
6.78%
Mortgage Type
Stand Alone First
Create a Home Valuation Report for This Property
The Home Valuation Report is an in-depth analysis detailing your home's value as well as a comparison with similar homes in the area
Home Values in the Area
Average Home Value in this Area
Purchase History
| Date | Buyer | Sale Price | Title Company |
|---|---|---|---|
| Shafer Steven G | -- | None Available | |
| Shafer Steven G | -- | New Century Title Company | |
| Shafer Steven G | $750,000 | New Century Title Company | |
| Grieco Thomas J | $455,000 | First American Title |
Source: Public Records
Mortgage History
| Date | Status | Borrower | Loan Amount |
|---|---|---|---|
| Previous Owner | Shafer Steven G | $400,000 | |
| Previous Owner | Grieco Thomas J | $318,211 | |
| Closed | Grieco Thomas J | $75,000 | |
| Closed | Shafer Steven G | $100,000 |
Source: Public Records
Tax History Compared to Growth
Tax History
| Year | Tax Paid | Tax Assessment Tax Assessment Total Assessment is a certain percentage of the fair market value that is determined by local assessors to be the total taxable value of land and additions on the property. | Land | Improvement |
|---|---|---|---|---|
| 2025 | $13,555 | $1,088,242 | $582,930 | $505,312 |
| 2024 | $13,555 | $1,066,904 | $571,500 | $495,404 |
| 2023 | $13,282 | $1,045,986 | $560,295 | $485,691 |
| 2022 | $13,082 | $1,025,477 | $549,309 | $476,168 |
| 2021 | $12,666 | $1,005,371 | $538,539 | $466,832 |
| 2020 | $12,751 | $995,063 | $533,017 | $462,046 |
| 2019 | $12,541 | $975,553 | $522,566 | $452,987 |
| 2018 | $12,002 | $956,425 | $512,320 | $444,105 |
| 2017 | $11,813 | $937,673 | $502,275 | $435,398 |
| 2016 | $11,299 | $900,661 | $492,427 | $408,234 |
| 2015 | $11,159 | $887,133 | $485,031 | $402,102 |
| 2014 | $10,970 | $869,756 | $475,530 | $394,226 |
Source: Public Records
Map
Nearby Homes
- 4261 Corte Langostino
- 4289 Calle Isabelino
- 10495 Abalone Landing Terrace
- 11325 Carmel Creek Rd
- 3767 Torrey View Ct
- 11280 Carmel Creek Rd
- 3738 Ruette San Raphael
- 11649 Thistle Hill Place
- 3854-56 Via Del Mar
- 0 Arroyo Sorrento Place Unit 250030141
- 4 Via Del Mar
- 3 Via Del Mar
- 10553 Gaylemont Ln Unit 5
- 3811 Via Del Mar
- 5231 Setting Sun Way
- 10140 Wateridge Cir Unit 124
- 10794 Spur Point Ct
- 3975 San Gregorio Way
- 10318 Wateridge Cir Unit 278
- 10292 Wateridge Cir Unit 253
- 4229 Via Mar de Delfinas
- 4243 Via Mar de Delfinas
- 4230 Calle Mejillones
- 4221 Via Mar de Delfinas
- 4222 Calle Mejillones
- 4215 Via Mar de Delfinas
- 4226 Via Mar de Delfinas
- 4240 Via Mar de Delfinas
- 4218 Calle Mejillones
- 4214 Calle Mejillones Unit 4
- 4231 Calle Mejillones
- 4237 Calle Mejillones
- 4218 Via Mar de Delfinas Unit 4
- 4241 Calle Mejillones Unit 4
- 4223 Calle Mejillones Unit 4
- 4207 Via Mar de Delfinas
- 4247 Calle Mejillones
- 4253 Calle Mejillones
- 4217 Calle Mejillones
- 4206 Calle Mejillones