42351 Masquaz Ct Temecula, CA 92592
Estimated Value: $572,002 - $605,000
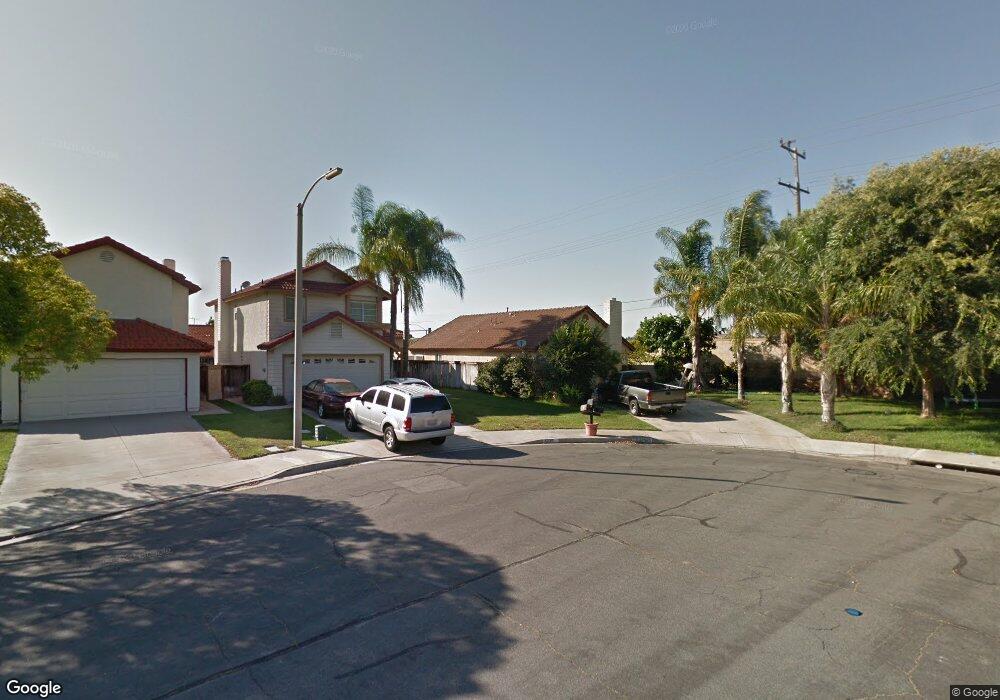
About This Home
This home is located at 42351 Masquaz Ct, Temecula, CA 92592 and is currently estimated at $592,001, approximately $462 per square foot. 42351 Masquaz Ct is a home located in Riverside County with nearby schools including Temecula Luiseno Elementary, Erle Stanley Gardner Middle School, and Great Oak High School.
Ownership History
We collect this data history from publicly available records. To have your information removed, we recommend requesting removal directly through your county’s website.
Purchase Details
Home Financials for this Owner
Home Financials are based on the most recent Mortgage that was taken out on this home.Purchase Details
Purchase Details
Home Financials for this Owner
Home Financials are based on the most recent Mortgage that was taken out on this home.Purchase History
We collect this data history from publicly available records. To have your information removed, we recommend requesting removal directly through your county’s website.
| Date | Buyer | Sale Price | Title Company |
|---|---|---|---|
| $207,000 | Fidelity National Title | ||
| $170,000 | Fnt | ||
| $395,000 | New Century Title Company |
Mortgage History
We collect this data history from publicly available records. To have your information removed, we recommend requesting removal directly through your county’s website.
| Date | Status | Borrower | Loan Amount |
|---|---|---|---|
| Open | $211,450 | ||
| Previous Owner | $316,000 |
Tax History
We collect this data history from publicly available records. To have your information removed, we recommend requesting removal directly through your county’s website.
| Year | Tax Paid | Tax Assessment Tax Assessment Total Assessment is a certain percentage of the fair market value that is determined by local assessors to be the total taxable value of land and additions on the property. | Land | Improvement |
|---|---|---|---|---|
| 2025 | $1,669 | $266,546 | $77,256 | $189,290 |
| 2023 | $1,669 | $256,198 | $74,257 | $181,941 |
| 2022 | $1,744 | $251,175 | $72,801 | $178,374 |
| 2021 | $1,696 | $246,251 | $71,374 | $174,877 |
| 2020 | $3,197 | $243,727 | $70,643 | $173,084 |
| 2019 | $3,149 | $238,949 | $69,258 | $169,691 |
| 2018 | $3,084 | $234,264 | $67,900 | $166,364 |
| 2017 | $3,028 | $229,671 | $66,569 | $163,102 |
| 2016 | $2,971 | $225,168 | $65,264 | $159,904 |
| 2015 | $2,918 | $221,788 | $64,285 | $157,503 |
| 2014 | $2,829 | $217,446 | $63,027 | $154,419 |
Map
- 31330 Eucalyptus Ct
- 31109 Shicali Ct
- 45486 Olive Ct
- 45733 Sierra Ct
- 45590 Basswood Ct
- 45946 Clubhouse Dr
- 45218 Via Vela
- 31312 Calle Cirros
- 31337 Huron St
- 31353 Huron St
- 31579 Mendocino Ct
- 31598 Six Rivers Ct
- 44972 Muirfield Dr
- 31605 Seastar Place
- 31258 Calle Cirros
- 45730 Hopactong St
- 31035 Strawberry Tree Ln Unit 84
- 45776 Klamath Ct
- 44972 Bellflower Ln Unit 27
- 45774 Hopactong St
- 42355 Masquaz Ct
- 42347 Masquaz Ct
- 42359 Masquaz Ct
- 42316 Via Consuelo
- 42312 Via Consuelo
- 42320 Via Consuelo
- 42363 Masquaz Ct
- 42324 Via Consuelo
- 42328 Via Consuelo
- 42367 Masquaz Ct
- 42348 Masquaz Ct
- 42352 Maskuaz Ct
- 42352 Masquaz Ct
- 42356 Masquaz Ct
- 42332 Via Consuelo
- 42360 Masquaz Ct
- 42332 Via Consuelo Ct
- 42371 Masquaz Ct
- 42364 Masquaz Ct
- 42336 Via Consuelo
Ask me questions while you tour the home.