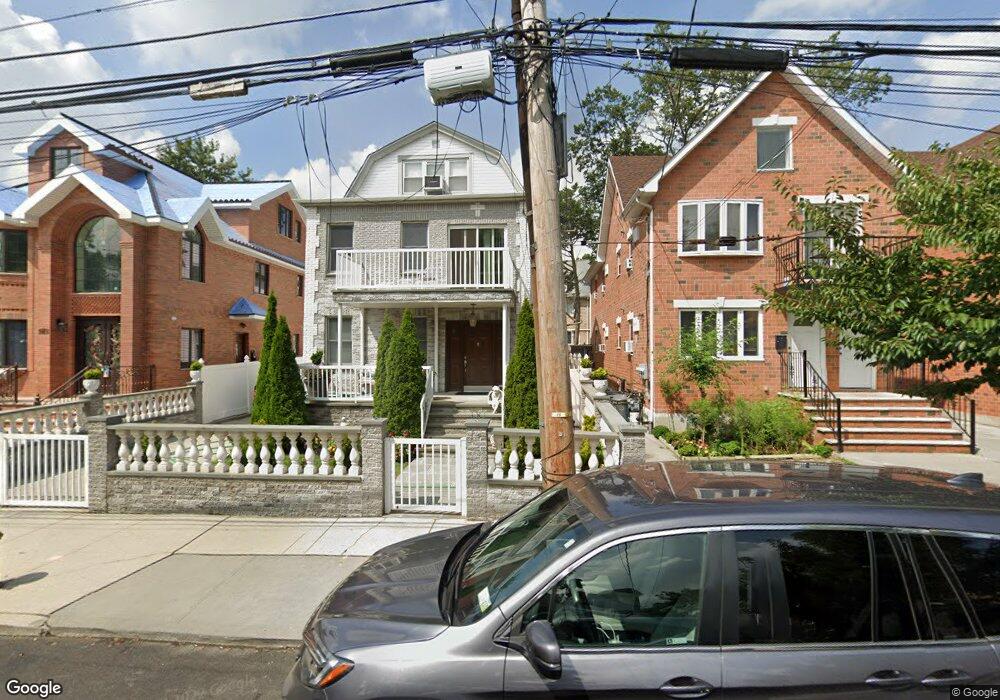
4236 161st St Flushing, NY 11358
Flushing NeighborhoodEstimated Value: $1,491,154 - $2,095,000
Studio
--
Bath
3,040
Sq Ft
$608/Sq Ft
Est. Value
About This Home
This home is located at 4236 161st St, Flushing, NY 11358 and is currently estimated at $1,849,039, approximately $608 per square foot. 4236 161st St is a home located in Queens County with nearby schools including P.S. 107 Thomas A Dooley, I.S. 25 Adrien Block, and Francis Lewis High School.
Ownership History
Date
Name
Owned For
Owner Type
Purchase Details
Closed on
Feb 19, 2025
Sold by
Yu Yong Ping
Bought by
The Yong Ping Yu Living Trust and Yong Ping Yu As Trustee
Current Estimated Value
Purchase Details
Closed on
Sep 7, 2023
Sold by
Mauro Charles J and Mauro Karen A
Bought by
Yu Yong Ping
Home Financials for this Owner
Home Financials are based on the most recent Mortgage that was taken out on this home.
Original Mortgage
$1,110,000
Interest Rate
7.09%
Mortgage Type
Purchase Money Mortgage
Purchase Details
Closed on
Oct 2, 2003
Sold by
Mauro Charles J
Bought by
Mauro Charles J and Mauro Karen A
Home Financials for this Owner
Home Financials are based on the most recent Mortgage that was taken out on this home.
Original Mortgage
$200,000
Interest Rate
5.88%
Mortgage Type
Purchase Money Mortgage
Purchase Details
Closed on
Sep 22, 2000
Sold by
Mauro Donato J and Mauro Antoinette
Bought by
Mauro Charles J
Create a Home Valuation Report for This Property
The Home Valuation Report is an in-depth analysis detailing your home's value as well as a comparison with similar homes in the area
Home Values in the Area
Average Home Value in this Area
Purchase History
| Date | Buyer | Sale Price | Title Company |
|---|---|---|---|
| The Yong Ping Yu Living Trust | -- | -- | |
| Yu Yong Ping | $1,850,000 | -- | |
| Yu Yong Ping | $1,850,000 | -- | |
| Yu Yong Ping | $1,850,000 | -- | |
| Mauro Charles J | -- | -- | |
| Mauro Charles J | -- | -- | |
| Mauro Charles J | -- | -- | |
| Mauro Charles J | -- | -- | |
| Mauro Charles J | -- | -- |
Source: Public Records
Mortgage History
| Date | Status | Borrower | Loan Amount |
|---|---|---|---|
| Previous Owner | Yu Yong Ping | $1,110,000 | |
| Previous Owner | Mauro Charles J | $200,000 |
Source: Public Records
Tax History
| Year | Tax Paid | Tax Assessment Tax Assessment Total Assessment is a certain percentage of the fair market value that is determined by local assessors to be the total taxable value of land and additions on the property. | Land | Improvement |
|---|---|---|---|---|
| 2025 | $10,027 | $49,924 | $10,925 | $38,999 |
| 2024 | $10,027 | $49,922 | $11,503 | $38,419 |
| 2023 | $9,304 | $47,724 | $9,310 | $38,414 |
| 2022 | $8,725 | $96,480 | $21,900 | $74,580 |
| 2021 | $8,984 | $79,980 | $21,900 | $58,080 |
| 2020 | $8,510 | $76,320 | $21,900 | $54,420 |
| 2019 | $8,410 | $65,340 | $21,900 | $43,440 |
| 2018 | $7,809 | $39,770 | $13,172 | $26,598 |
| 2017 | $7,369 | $37,621 | $12,260 | $25,361 |
| 2016 | $7,036 | $37,621 | $12,260 | $25,361 |
| 2015 | $4,061 | $34,669 | $15,901 | $18,768 |
| 2014 | $4,061 | $34,669 | $17,617 | $17,052 |
Source: Public Records
Map
Nearby Homes
- 43-7 162nd St
- 43-27 162nd St
- 4344 161st St
- 42-16 162nd St
- 43-33 163rd St
- 43-58 163rd St
- 4363 160th St
- 43-15 164th St
- 16003 Sanford Ave
- 16001 Sanford Ave
- 43-04 158th St Unit 3E
- 163-02 45th Ave
- 4304 158th St Unit L4
- 42-20 158th St
- 42-60 157th St Unit 3D
- 4018 165th St
- 43-23 156th St
- 45-57 160th St
- 167-22 Northern Blvd
- 42-36 156th St
- 4236 161st St
- 4236 161st St Unit 2
- 4232 161st St
- 4240 161st St
- 42-40 161 St
- 42-40 161st St
- 4240 161st St
- 4230 161st St
- 4230 161st St Unit 2
- 42-30 161st St Unit 2
- 4244 161st St
- 42-26 161st St Unit 1 Fl
- 4226 161st St
- 4237 160th St
- 4235 160th St
- 4237 160th St Unit 1Fl
- 4241 160th St
- 4234 160th St
- 4248 161st St
- 4241 160th St