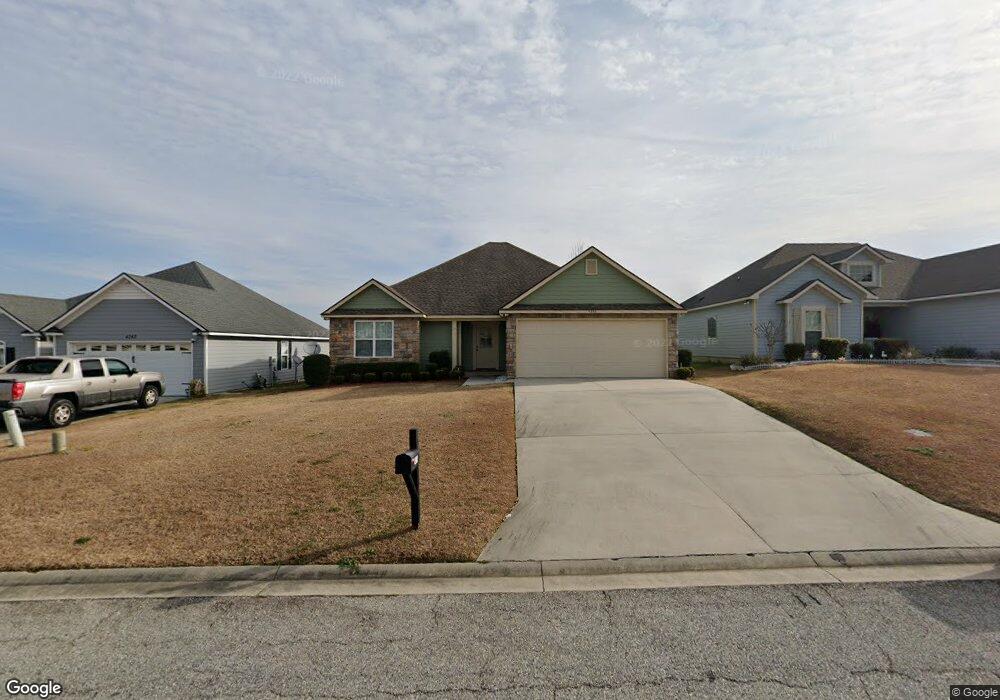
4236 Ginger Trail Valdosta, GA 31602
Estimated Value: $237,513 - $257,000
3
Beds
2
Baths
1,455
Sq Ft
$168/Sq Ft
Est. Value
About This Home
This home is located at 4236 Ginger Trail, Valdosta, GA 31602 and is currently estimated at $244,628, approximately $168 per square foot. 4236 Ginger Trail is a home located in Lowndes County with nearby schools including Westside Elementary School, Hahira Middle School, and Lowndes High School.
Ownership History
Date
Name
Owned For
Owner Type
Purchase Details
Closed on
Apr 25, 2024
Sold by
Yuvan Frank P
Bought by
Patel Chandrakant and Patel Monika
Current Estimated Value
Home Financials for this Owner
Home Financials are based on the most recent Mortgage that was taken out on this home.
Original Mortgage
$129,000
Outstanding Balance
$127,160
Interest Rate
6.79%
Mortgage Type
New Conventional
Estimated Equity
$117,468
Purchase Details
Closed on
Sep 3, 2021
Sold by
Southern Cardinal Homes Llc
Bought by
Yuvann Frank P
Home Financials for this Owner
Home Financials are based on the most recent Mortgage that was taken out on this home.
Original Mortgage
$193,244
Interest Rate
2.7%
Mortgage Type
VA
Purchase Details
Closed on
May 24, 2011
Sold by
Bassford N L
Bought by
Southern Cardinal Homes Llc
Purchase Details
Closed on
Nov 17, 1998
Bought by
Evans Diversified
Create a Home Valuation Report for This Property
The Home Valuation Report is an in-depth analysis detailing your home's value as well as a comparison with similar homes in the area
Home Values in the Area
Average Home Value in this Area
Purchase History
| Date | Buyer | Sale Price | Title Company |
|---|---|---|---|
| Patel Chandrakant | $219,000 | -- | |
| Yuvann Frank P | $188,900 | -- | |
| Southern Cardinal Homes Llc | $46,000 | -- | |
| Evans Diversified | -- | -- |
Source: Public Records
Mortgage History
| Date | Status | Borrower | Loan Amount |
|---|---|---|---|
| Open | Patel Chandrakant | $129,000 | |
| Previous Owner | Yuvann Frank P | $193,244 |
Source: Public Records
Tax History Compared to Growth
Tax History
| Year | Tax Paid | Tax Assessment Tax Assessment Total Assessment is a certain percentage of the fair market value that is determined by local assessors to be the total taxable value of land and additions on the property. | Land | Improvement |
|---|---|---|---|---|
| 2024 | $1,978 | $80,355 | $7,200 | $73,155 |
| 2023 | $1,978 | $75,130 | $7,200 | $67,930 |
| 2022 | $1,957 | $67,999 | $7,200 | $60,799 |
| 2021 | $1,505 | $49,575 | $7,200 | $42,375 |
| 2020 | $1,402 | $49,575 | $7,200 | $42,375 |
| 2019 | $1,416 | $49,575 | $7,200 | $42,375 |
| 2018 | $1,328 | $45,890 | $7,200 | $38,690 |
| 2017 | $1,341 | $45,890 | $7,200 | $38,690 |
| 2016 | $1,345 | $45,890 | $7,200 | $38,690 |
| 2015 | -- | $45,890 | $7,200 | $38,690 |
| 2014 | $1,424 | $49,840 | $8,800 | $41,040 |
Source: Public Records
Map
Nearby Homes
- 4082 Northlake Dr
- 4114 Ginger Trail
- 4268 Deercrest Dr
- 4153 Springruff Dr
- 4107 Springruff Dr
- 4311 Shiloh Trace
- 4311 Mossy Creek Rd
- Tract 3 SW I-75 Exit 22 Sw Shiloh Rd & Val Tech Rd
- Tract 2 SW I-75 Exit 22 Se North Valdosta Rd & Val Tech Rd
- 4438 Huntington Pointe
- 4301 Shiloh Trace
- Tract 1 SE I-75 Exit 22 North Valdosta Rd & Flythe Rd
- 4406 Forest Valley Cir
- 4728 Woodland Point
- 4616 Rain Wood Cir
- 4715 Woodland Point
- 4849 Oak Arbor Dr
- 3813 Winchester Place
- 4762 Blackwater Dr
- 4577 San Saba Dr
- 4232 Ginger Trail
- 4242 Ginger Trail
- 4367 Autumn Ridge
- 4226 Ginger Trail
- 4432 Summer Hill Place
- 4363 Autumn Ridge
- 4235 Ginger Trail
- 4244 Ginger Trail
- 4222 Ginger Trail
- 4239 Ginger Trail
- 4231 Ginger Trail
- 4243 Ginger Trail
- 4250 Ginger Trail
- 4225 Ginger Trail
- 4401 Ivydale Ct
- 4359 Autumn Ridge
- 4431 Summer Hill Place
- 4247 Ginger Trail
- 4221 Ginger Trail
- 4218 Ginger Trail