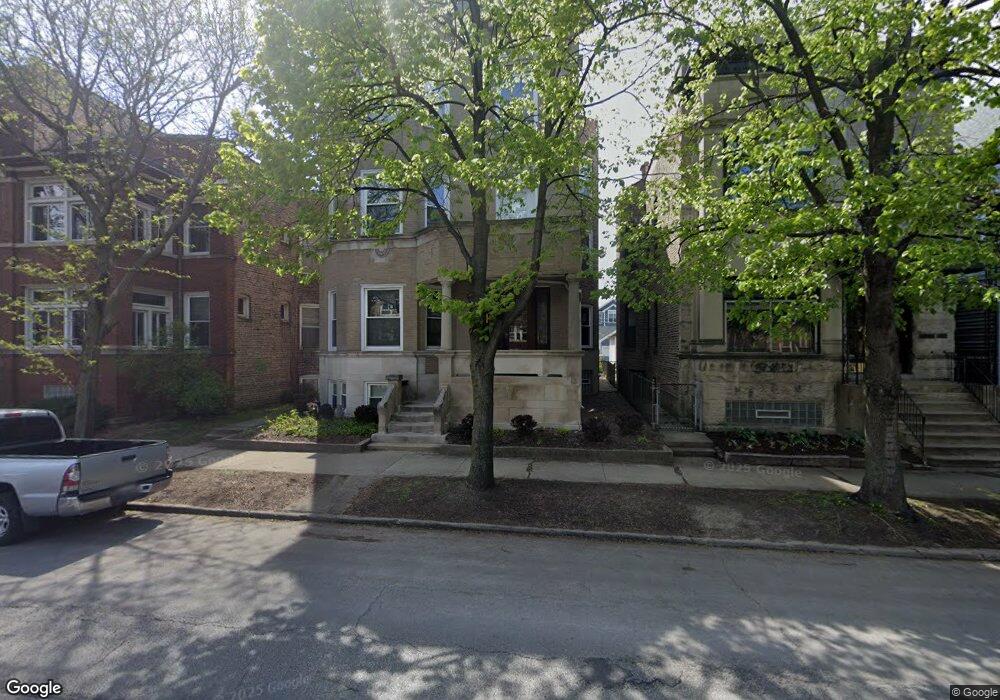
4236 N Ashland Ave Unit 1 Chicago, IL 60613
Ravenswood NeighborhoodEstimated Value: $502,000 - $752,312
3
Beds
3
Baths
2,300
Sq Ft
$264/Sq Ft
Est. Value
About This Home
This home is located at 4236 N Ashland Ave Unit 1, Chicago, IL 60613 and is currently estimated at $607,078, approximately $263 per square foot. 4236 N Ashland Ave Unit 1 is a home located in Cook County with nearby schools including Ravenswood Elementary School, Lake View High School, and Chicago Montessori School.
Ownership History
Date
Name
Owned For
Owner Type
Purchase Details
Closed on
Aug 18, 2016
Sold by
Hertz Noel P and Eiseman Sharon L
Bought by
Hertz Noel P and Eiseman Sharon L
Current Estimated Value
Purchase Details
Closed on
Oct 21, 2011
Sold by
Hertz Noel and Eiseman Sharon
Bought by
Hertz Noel P and Eiseman Sharon L
Purchase Details
Closed on
Aug 1, 2005
Sold by
So Jeffrey and So Michelle
Bought by
Hertz Noel and Eiseman Sharon
Purchase Details
Closed on
Jan 9, 2001
Sold by
Albany Bank & Trust Company Na
Bought by
So Jeffrey and So Michelle
Home Financials for this Owner
Home Financials are based on the most recent Mortgage that was taken out on this home.
Original Mortgage
$263,000
Interest Rate
7.69%
Create a Home Valuation Report for This Property
The Home Valuation Report is an in-depth analysis detailing your home's value as well as a comparison with similar homes in the area
Home Values in the Area
Average Home Value in this Area
Purchase History
| Date | Buyer | Sale Price | Title Company |
|---|---|---|---|
| Hertz Noel P | -- | Attorney | |
| Hertz Noel P | -- | None Available | |
| Hertz Noel | $410,000 | Ctic | |
| So Jeffrey | $370,000 | -- |
Source: Public Records
Mortgage History
| Date | Status | Borrower | Loan Amount |
|---|---|---|---|
| Previous Owner | So Jeffrey | $263,000 | |
| Closed | So Jeffrey | $88,400 |
Source: Public Records
Tax History Compared to Growth
Tax History
| Year | Tax Paid | Tax Assessment Tax Assessment Total Assessment is a certain percentage of the fair market value that is determined by local assessors to be the total taxable value of land and additions on the property. | Land | Improvement |
|---|---|---|---|---|
| 2024 | $10,345 | $70,743 | $25,107 | $45,636 |
| 2023 | $10,046 | $55,000 | $20,187 | $34,813 |
| 2022 | $10,046 | $55,000 | $20,187 | $34,813 |
| 2021 | $9,854 | $54,998 | $20,186 | $34,812 |
| 2020 | $10,110 | $50,969 | $12,112 | $38,857 |
| 2019 | $10,056 | $56,223 | $12,112 | $44,111 |
| 2018 | $9,884 | $56,223 | $12,112 | $44,111 |
| 2017 | $9,586 | $50,608 | $10,598 | $40,010 |
| 2016 | $9,279 | $50,608 | $10,598 | $40,010 |
| 2015 | $8,450 | $50,608 | $10,598 | $40,010 |
| 2014 | $7,795 | $46,417 | $8,137 | $38,280 |
| 2013 | $7,622 | $46,417 | $8,137 | $38,280 |
Source: Public Records
Map
Nearby Homes
- 4244 N Ashland Ave
- 4153 N Hermitage Ave
- 1722 W Belle Plaine Ave
- 1510 W Montrose Ave
- 1447 W Warner Ave Unit 3W
- 4415 N Ashland Ave
- 1446 W Belle Plaine Ave
- 4422 N Ashland Ave Unit G
- 1416 W Warner Ave
- 4444 N Greenview Ave
- 4305 N Wolcott Ave
- 1511 W Irving Park Rd Unit 1W
- 1431 W Cuyler Ave Unit 1S
- 4501 N Ashland Ave Unit 1S
- 1442 W Irving Park Rd
- 1426 W Irving Park Rd Unit 4
- 1907 W Montrose Ave Unit 2
- 4421 N Beacon St Unit 3S
- 4537 N Greenview Ave
- 4003 N Wolcott Ave Unit F
- 4236 N Ashland Ave Unit 2
- 4236 N Ashland Ave Unit 3
- 4232 N Ashland Ave
- 4230 N Ashland Ave Unit 1
- 4230 N Ashland Ave Unit 3
- 4230 N Ashland Ave Unit G
- 4240 N Ashland Ave
- 4240 N Ashland Ave Unit 1
- 4240 N Ashland Ave
- 4240 N Ashland Ave Unit 2
- 4226 N Ashland Ave Unit 1A
- 4226 N Ashland Ave Unit 3B
- 4226 N Ashland Ave Unit 2A
- 4226 N Ashland Ave
- 4226 N Ashland Ave Unit 4A
- 4226 N Ashland Ave Unit 1B
- 4226 N Ashland Ave Unit 4B
- 4226 N Ashland Ave Unit 2B
- 4226 N Ashland Ave Unit 3A
- 4242 N Ashland Ave