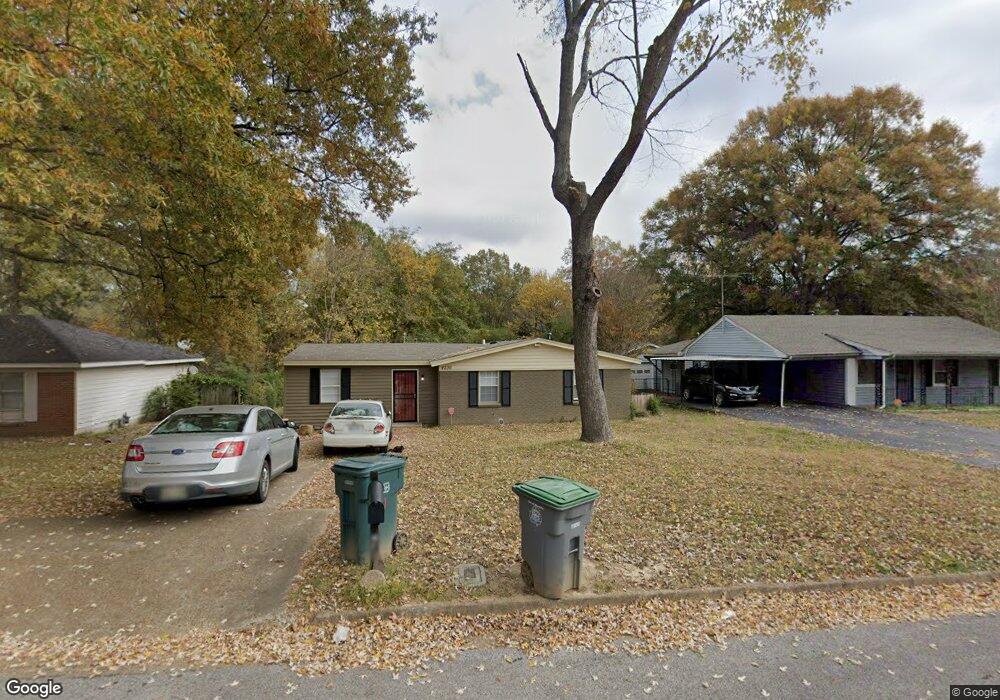
4236 Windermere Rd Memphis, TN 38128
Raleigh NeighborhoodEstimated Value: $114,000 - $157,000
4
Beds
1
Bath
1,352
Sq Ft
$99/Sq Ft
Est. Value
About This Home
This home is located at 4236 Windermere Rd, Memphis, TN 38128 and is currently estimated at $133,377, approximately $98 per square foot. 4236 Windermere Rd is a home located in Shelby County with nearby schools including Egypt Elementary School, Raleigh Egypt High School, and Promise Academy - Spring Hill.
Ownership History
Date
Name
Owned For
Owner Type
Purchase Details
Closed on
Aug 20, 2013
Sold by
Mid South Homebuyers Inc
Bought by
The Rivas Group Llc
Current Estimated Value
Home Financials for this Owner
Home Financials are based on the most recent Mortgage that was taken out on this home.
Original Mortgage
$34,020
Interest Rate
4.39%
Mortgage Type
Purchase Money Mortgage
Purchase Details
Closed on
Jun 10, 2013
Sold by
Wmmc Construction Llc
Bought by
Mid South Homebuyers Inc
Purchase Details
Closed on
Feb 18, 2010
Sold by
F & S Property Investments Llc
Bought by
Lemmon Thomas and Lemmon Dorothy
Purchase Details
Closed on
Jun 8, 2009
Sold by
Snipes Marilyn F
Bought by
Secretary Of Housing & Urban Development
Purchase Details
Closed on
Oct 6, 1995
Bought by
Easterwood Judith G
Create a Home Valuation Report for This Property
The Home Valuation Report is an in-depth analysis detailing your home's value as well as a comparison with similar homes in the area
Home Values in the Area
Average Home Value in this Area
Purchase History
| Date | Buyer | Sale Price | Title Company |
|---|---|---|---|
| The Rivas Group Llc | $56,700 | None Available | |
| Mid South Homebuyers Inc | $17,000 | Saddle Creek Title Llc | |
| Wmmc Consultants Llc | $10,000 | Saddle Creek Title Llc | |
| Lemmon Thomas | $20,900 | None Available | |
| Secretary Of Housing & Urban Development | $51,456 | None Available | |
| Easterwood Judith G | $43,000 | -- |
Source: Public Records
Mortgage History
| Date | Status | Borrower | Loan Amount |
|---|---|---|---|
| Closed | The Rivas Group Llc | $34,020 |
Source: Public Records
Tax History Compared to Growth
Tax History
| Year | Tax Paid | Tax Assessment Tax Assessment Total Assessment is a certain percentage of the fair market value that is determined by local assessors to be the total taxable value of land and additions on the property. | Land | Improvement |
|---|---|---|---|---|
| 2025 | $597 | $28,300 | $2,875 | $25,425 |
| 2024 | $597 | $17,600 | $2,250 | $15,350 |
| 2023 | $1,072 | $17,600 | $2,250 | $15,350 |
| 2022 | $1,072 | $17,600 | $2,250 | $15,350 |
| 2021 | $1,085 | $17,600 | $2,250 | $15,350 |
| 2020 | $1,000 | $13,800 | $2,250 | $11,550 |
| 2019 | $1,000 | $13,800 | $2,250 | $11,550 |
| 2018 | $1,000 | $13,800 | $2,250 | $11,550 |
| 2017 | $567 | $13,800 | $2,250 | $11,550 |
| 2016 | $562 | $12,850 | $0 | $0 |
| 2014 | $562 | $12,850 | $0 | $0 |
Source: Public Records
Map
Nearby Homes
- 4250 Trudy St
- 3704 Ridgemont Ave
- 3614 Trudy Cove
- 4188 Time St
- 4100 Hitchcock Dr
- 3793 Tessland Rd
- 4058 Sandburg St
- 4040 Windermere Rd
- 4060 Hitchcock Dr
- 4378 Shadcrest Rd
- 1 Hobson Rd
- 4135 Kerwin Dr
- 3875 Wordsworth Ave
- 4071 Kerwin Dr
- 3401 Bradcrest Dr
- 3358 Brockcrest Cove
- 3924 Winwood Dr
- 2807 Epping Crest Cove
- 2831 Epping Crest Cove
- 2823 Epping Crest Cove
- 4242 Windermere Rd
- 4230 Windermere Rd
- 4248 Windermere Rd
- 4222 Windermere Rd
- 4243 Hobson Rd
- 4239 Hobson Rd
- 4249 Hobson Rd
- 4237 Windermere Rd
- 4231 Windermere Rd
- 4216 Windermere Rd
- 4254 Windermere Rd
- 4243 Windermere Rd
- 4273 Hobson Cove
- 4269 Hobson Cove
- 4233 Hobson Rd
- 4223 Windermere Rd
- 4250 Hobson Rd
- 4217 Windermere Rd
- 4210 Windermere Rd
- 4260 Windermere Rd