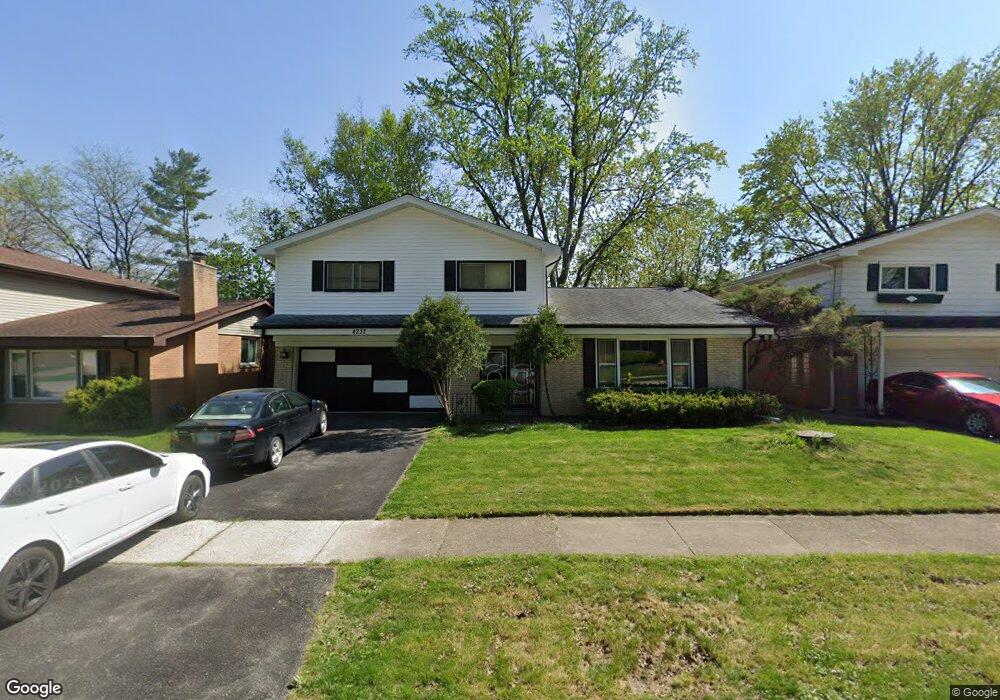
4237 Applewood Ln Matteson, IL 60443
Old Matteson NeighborhoodEstimated Value: $278,817 - $363,000
4
Beds
3
Baths
2,258
Sq Ft
$148/Sq Ft
Est. Value
About This Home
This home is located at 4237 Applewood Ln, Matteson, IL 60443 and is currently estimated at $333,454, approximately $147 per square foot. 4237 Applewood Ln is a home located in Cook County with nearby schools including Illinois School, Arcadia Elementary School, and Indiana Elementary School.
Ownership History
Date
Name
Owned For
Owner Type
Purchase Details
Closed on
Jun 15, 2009
Sold by
Thomalla Robert J
Bought by
Thompson Anthony
Current Estimated Value
Home Financials for this Owner
Home Financials are based on the most recent Mortgage that was taken out on this home.
Original Mortgage
$176,248
Outstanding Balance
$115,261
Interest Rate
5.43%
Mortgage Type
FHA
Estimated Equity
$218,193
Purchase Details
Closed on
May 11, 2009
Sold by
Thomalla Robert J
Bought by
Thomalla Robert J
Home Financials for this Owner
Home Financials are based on the most recent Mortgage that was taken out on this home.
Original Mortgage
$176,248
Outstanding Balance
$115,261
Interest Rate
5.43%
Mortgage Type
FHA
Estimated Equity
$218,193
Purchase Details
Closed on
Jan 15, 2007
Sold by
Thomalla Robert J and Thomalla Mary Ann
Bought by
Thomalla Mary Ann and The Mary Ann Thomalla Revocable Trust Of
Create a Home Valuation Report for This Property
The Home Valuation Report is an in-depth analysis detailing your home's value as well as a comparison with similar homes in the area
Home Values in the Area
Average Home Value in this Area
Purchase History
| Date | Buyer | Sale Price | Title Company |
|---|---|---|---|
| Thompson Anthony | $179,500 | Attorneys Title Guaranty Fun | |
| Thomalla Robert J | -- | Attorneys Title Guaranty Fun | |
| Thomalla Robert J | -- | Attorneys Title Guaranty Fun | |
| Thomalla Mary Ann | -- | Chicago Title Insurance Co |
Source: Public Records
Mortgage History
| Date | Status | Borrower | Loan Amount |
|---|---|---|---|
| Open | Thompson Anthony | $176,248 |
Source: Public Records
Tax History Compared to Growth
Tax History
| Year | Tax Paid | Tax Assessment Tax Assessment Total Assessment is a certain percentage of the fair market value that is determined by local assessors to be the total taxable value of land and additions on the property. | Land | Improvement |
|---|---|---|---|---|
| 2024 | $7,867 | $25,000 | $3,000 | $22,000 |
| 2023 | $5,577 | $25,000 | $3,000 | $22,000 |
| 2022 | $5,577 | $16,436 | $2,625 | $13,811 |
| 2021 | $4,826 | $16,436 | $2,625 | $13,811 |
| 2020 | $4,737 | $16,436 | $2,625 | $13,811 |
| 2019 | $4,627 | $15,113 | $2,437 | $12,676 |
| 2018 | $3,732 | $15,113 | $2,437 | $12,676 |
| 2017 | $4,490 | $15,113 | $2,437 | $12,676 |
| 2016 | $6,802 | $13,834 | $2,250 | $11,584 |
| 2015 | $4,839 | $14,424 | $2,250 | $12,174 |
| 2014 | $6,811 | $14,424 | $2,250 | $12,174 |
| 2013 | $3,883 | $14,443 | $2,250 | $12,193 |
Source: Public Records
Map
Nearby Homes
- 4329 Applewood Ln
- 4108 Applewood Ln
- 748 Kostner Ave
- 706 Carnation Ln
- 831 Violet Ln
- 807 Violet Ln
- 21130 Kildare Ave
- 820 Exmoor Rd
- 663 Primrose Ln
- 4608 Lindenwood Ct
- 4200 Washington Ave
- 20520 Crawford Ave
- 4550 Columbine Ln
- 20920 Governors Hwy
- 552 Academy Ave
- 548 Academy Ave
- 20340 Crawford Ave
- 3718 211th Place
- 4500 203rd St
- 21142 Locust St
- 4233 Applewood Ln
- 4243 Applewood Ln
- 4227 Applewood Ln
- 4247 Applewood Ln
- 4223 Applewood Ln
- 4238 Applewood Ln
- 4301 Applewood Ln
- 4234 Applewood Ln
- 4244 Applewood Ln
- 4300 Lindenwood Dr
- 4300 Lindenwood Dr Unit 3SE
- 4228 Applewood Ln
- 4306 Lindenwood Dr Unit 3NW
- 4248 Applewood Ln
- 4219 Applewood Ln
- 4305 Applewood Ln
- 4224 Applewood Ln
- 4302 Applewood Ln
- 4220 Applewood Ln
- 4237 Oakwood Ln