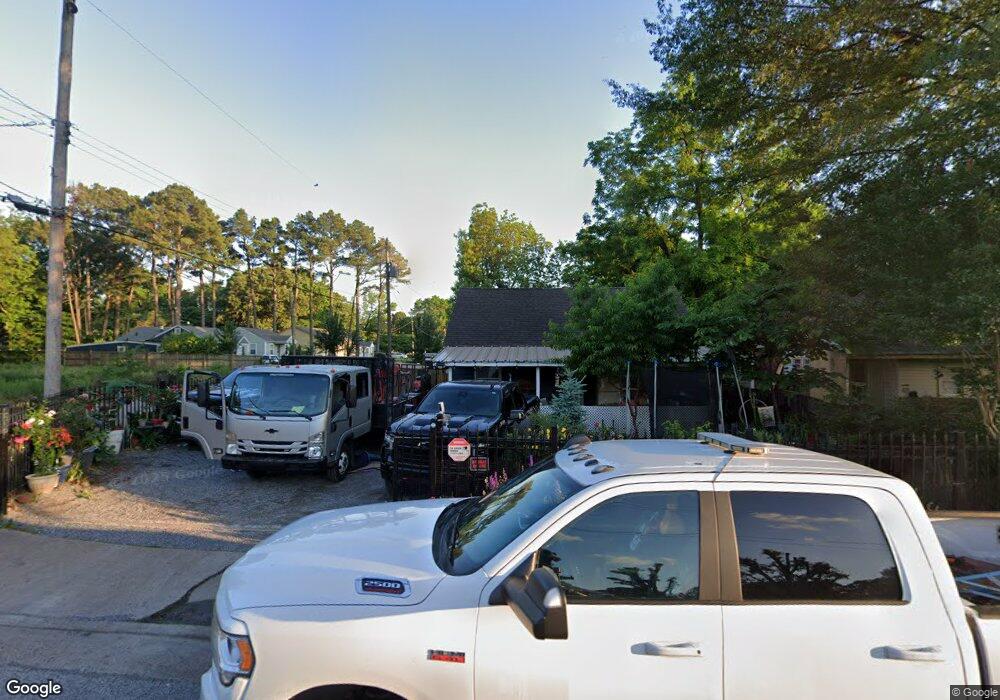
4237 Barr Ave Memphis, TN 38111
Colonial Acres NeighborhoodEstimated Value: $67,000 - $103,000
2
Beds
1
Bath
928
Sq Ft
$89/Sq Ft
Est. Value
About This Home
This home is located at 4237 Barr Ave, Memphis, TN 38111 and is currently estimated at $82,674, approximately $89 per square foot. 4237 Barr Ave is a home located in Shelby County with nearby schools including South Park Elementary School, Colonial Middle, and Overton High.
Ownership History
Date
Name
Owned For
Owner Type
Purchase Details
Closed on
Nov 16, 2012
Sold by
Robertson Robin and Robertson Margaret
Bought by
Aquino Noe Martinez
Current Estimated Value
Purchase Details
Closed on
Sep 27, 2002
Sold by
Carr Stella Mae
Bought by
Robertson Robin and Robertson Margaret
Home Financials for this Owner
Home Financials are based on the most recent Mortgage that was taken out on this home.
Original Mortgage
$11,000
Interest Rate
6.19%
Mortgage Type
Seller Take Back
Purchase Details
Closed on
Oct 18, 2001
Sold by
Avery Cheryl Marie
Bought by
Carr Stella Mae
Purchase Details
Closed on
Jan 27, 1998
Sold by
Smith S Joyce and James Judy Darnell
Bought by
Avery Cheryl Marie
Home Financials for this Owner
Home Financials are based on the most recent Mortgage that was taken out on this home.
Original Mortgage
$40,000
Interest Rate
7.07%
Mortgage Type
Seller Take Back
Purchase Details
Closed on
Nov 5, 1997
Sold by
Carr Stella Mae
Bought by
Smith S Joyce and Jones Judy Darnell
Create a Home Valuation Report for This Property
The Home Valuation Report is an in-depth analysis detailing your home's value as well as a comparison with similar homes in the area
Home Values in the Area
Average Home Value in this Area
Purchase History
| Date | Buyer | Sale Price | Title Company |
|---|---|---|---|
| Aquino Noe Martinez | $18,000 | None Available | |
| Robertson Robin | $20,000 | First American Title Ins Co | |
| Carr Stella Mae | -- | First American Title Ins Co | |
| Avery Cheryl Marie | $40,000 | -- | |
| Avery Cheryl Marie | $40,000 | -- | |
| Smith S Joyce | -- | -- | |
| Smith S Joyce | -- | -- |
Source: Public Records
Mortgage History
| Date | Status | Borrower | Loan Amount |
|---|---|---|---|
| Previous Owner | Robertson Robin | $11,000 | |
| Previous Owner | Avery Cheryl Marie | $40,000 |
Source: Public Records
Tax History
| Year | Tax Paid | Tax Assessment Tax Assessment Total Assessment is a certain percentage of the fair market value that is determined by local assessors to be the total taxable value of land and additions on the property. | Land | Improvement |
|---|---|---|---|---|
| 2025 | -- | $11,550 | $1,800 | $9,750 |
| 2024 | $189 | $5,575 | $1,325 | $4,250 |
| 2023 | $340 | $5,575 | $1,325 | $4,250 |
| 2022 | $340 | $5,575 | $1,325 | $4,250 |
| 2021 | $344 | $5,575 | $1,325 | $4,250 |
| 2020 | $324 | $4,475 | $800 | $3,675 |
| 2019 | $324 | $4,475 | $800 | $3,675 |
| 2018 | $324 | $4,475 | $800 | $3,675 |
| 2017 | $184 | $4,475 | $800 | $3,675 |
| 2016 | $200 | $4,575 | $0 | $0 |
| 2014 | $200 | $4,575 | $0 | $0 |
Source: Public Records
Map
Nearby Homes
- 1879 Ezell St
- 1864 Denison St
- 1809 Cherry Rd
- 4825 American Way
- 1783 Danville Rd
- 1744 Dearing Rd
- 1886 Danville Rd
- 4471 Jamaica Ave
- 1628 Cherry Rd
- 1903 Capri Rd
- 4187 Boyce Ave
- 1597 Michael St
- 1869 Sea Isle Rd
- 4261 Boyce Rd
- 1731 Sea Isle Rd
- 1750 Sea Isle Rd
- 1563 Flamingo Rd
- 1771 Tahiti Ln
- 4224 Arrowhead Rd
- 4487 E Dearing Rd
- 4229 Barr Ave
- 1861 S Goodlett St
- 4225 Barr Ave
- 1865 S Goodlett St
- 4245 Barr Ave
- 1860 S Goodlett St
- 1862 S Goodlett St
- 4249 Barr Ave
- 1869 S Goodlett St
- 4215 Barr Ave
- 1864 S Goodlett St
- 4255 Barr Ave
- 4238 Barr Ave
- 4259 Barr Ave
- 4222 Barr Ave
- 4209 Barr Ave
- 1872 S Goodlett St
- 4265 Barr Ave
- 1878 S Goodlett St
- 4212 Barr Ave
Your Personal Tour Guide
Ask me questions while you tour the home.