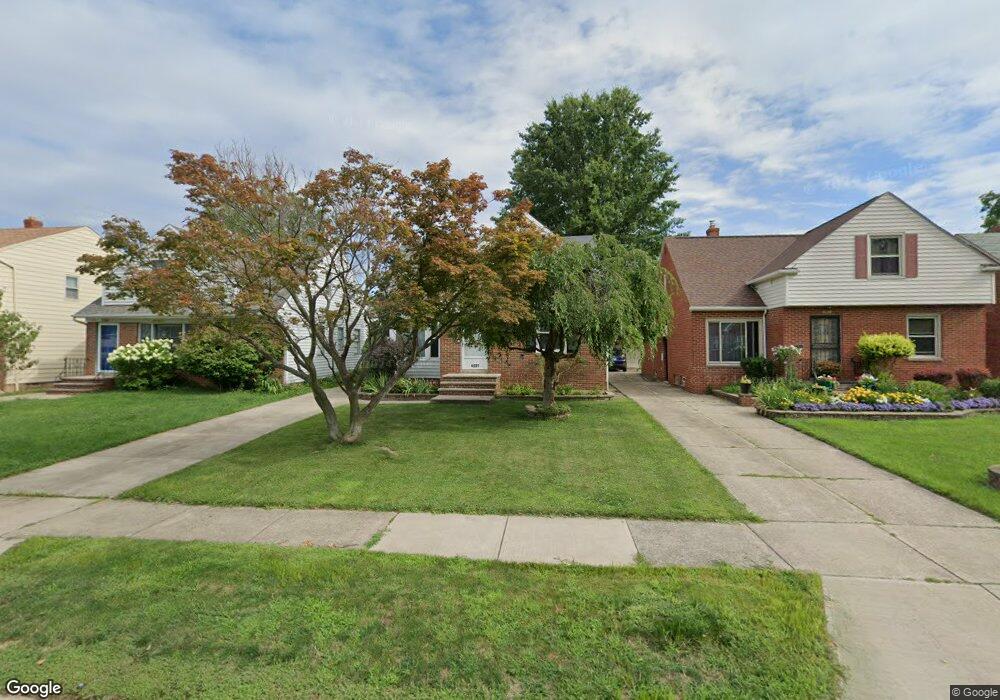
4237 Stonehaven Rd Cleveland, OH 44121
Estimated Value: $176,000 - $224,000
4
Beds
2
Baths
1,588
Sq Ft
$126/Sq Ft
Est. Value
About This Home
This home is located at 4237 Stonehaven Rd, Cleveland, OH 44121 and is currently estimated at $199,301, approximately $125 per square foot. 4237 Stonehaven Rd is a home located in Cuyahoga County with nearby schools including Rowland Elementary School, Greenview Upper Elementary School, and Memorial Junior High School.
Ownership History
Date
Name
Owned For
Owner Type
Purchase Details
Closed on
Jul 20, 2010
Sold by
Handler Vanessa and Handler Vanessa C
Bought by
Williams Andrea R
Current Estimated Value
Home Financials for this Owner
Home Financials are based on the most recent Mortgage that was taken out on this home.
Original Mortgage
$88,804
Outstanding Balance
$57,609
Interest Rate
4.25%
Mortgage Type
FHA
Estimated Equity
$141,692
Purchase Details
Closed on
Sep 27, 1991
Sold by
Heupler Frederick A
Bought by
Handler Bennet H
Purchase Details
Closed on
Aug 14, 1991
Sold by
Heupler Frederick A
Bought by
Heupler Frederick A
Purchase Details
Closed on
Jul 15, 1986
Sold by
Horwitz Morton A
Bought by
Heupler Frederick A
Purchase Details
Closed on
Sep 1, 1978
Sold by
Charna Myron S and Charna Evelyn
Bought by
Horwitz Morton A
Purchase Details
Closed on
Jan 1, 1975
Bought by
Charna Myron S and Charna Evelyn
Create a Home Valuation Report for This Property
The Home Valuation Report is an in-depth analysis detailing your home's value as well as a comparison with similar homes in the area
Home Values in the Area
Average Home Value in this Area
Purchase History
| Date | Buyer | Sale Price | Title Company |
|---|---|---|---|
| Williams Andrea R | $90,000 | Revere Title | |
| Handler Bennet H | $76,500 | -- | |
| Heupler Frederick A | -- | -- | |
| Heupler Frederick A | $59,500 | -- | |
| Horwitz Morton A | $56,000 | -- | |
| Charna Myron S | -- | -- |
Source: Public Records
Mortgage History
| Date | Status | Borrower | Loan Amount |
|---|---|---|---|
| Open | Williams Andrea R | $88,804 |
Source: Public Records
Tax History Compared to Growth
Tax History
| Year | Tax Paid | Tax Assessment Tax Assessment Total Assessment is a certain percentage of the fair market value that is determined by local assessors to be the total taxable value of land and additions on the property. | Land | Improvement |
|---|---|---|---|---|
| 2024 | $4,129 | $53,760 | $9,835 | $43,925 |
| 2023 | $3,496 | $36,510 | $7,140 | $29,370 |
| 2022 | $3,477 | $36,505 | $7,140 | $29,365 |
| 2021 | $3,451 | $36,510 | $7,140 | $29,370 |
| 2020 | $3,229 | $29,680 | $5,810 | $23,870 |
| 2019 | $2,951 | $84,800 | $16,600 | $68,200 |
| 2018 | $2,879 | $29,680 | $5,810 | $23,870 |
| 2017 | $2,849 | $26,320 | $4,760 | $21,560 |
| 2016 | $2,832 | $26,320 | $4,760 | $21,560 |
| 2015 | $2,881 | $26,320 | $4,760 | $21,560 |
| 2014 | $2,881 | $27,730 | $5,010 | $22,720 |
Source: Public Records
Map
Nearby Homes
- 4233 Bayard Rd
- 4210 Stonehaven Rd
- 4194 Stilmore Rd
- 4237 Verona Rd
- 4124 Bayard Rd
- 4206 Verona Rd
- 1940 Temblethurst Rd
- 4121 Hinsdale Rd
- 1895 Temblethurst Rd
- 4201 Lambert Rd
- 4158 Wyncote Rd
- 4154 Bexley Blvd
- 4033 Stonehaven Rd
- 4040 Bayard Rd
- 4015 Bayard Rd
- 1819 Warrensville Center Rd
- 1744 S Green Rd
- 4197 Okalona Rd
- 1779 Warrensville Center Rd
- 2091 S Belvoir Blvd
- 4241 Stonehaven Rd
- 4233 Stonehaven Rd
- 4245 Stonehaven Rd
- 4229 Stonehaven Rd
- 4225 Stonehaven Rd
- 4238 Bayard Rd
- 4242 Bayard Rd
- 4236 Bayard Rd
- 4246 Bayard Rd
- 4234 Bayard Rd
- 4221 Stonehaven Rd
- 4230 Bayard Rd
- 4238 Stonehaven Rd
- 4234 Stonehaven Rd
- 4242 Stonehaven Rd
- 4250 Bayard Rd
- 4217 Stonehaven Rd
- 4230 Stonehaven Rd
- 4246 Stonehaven Rd
- 4226 Bayard Rd