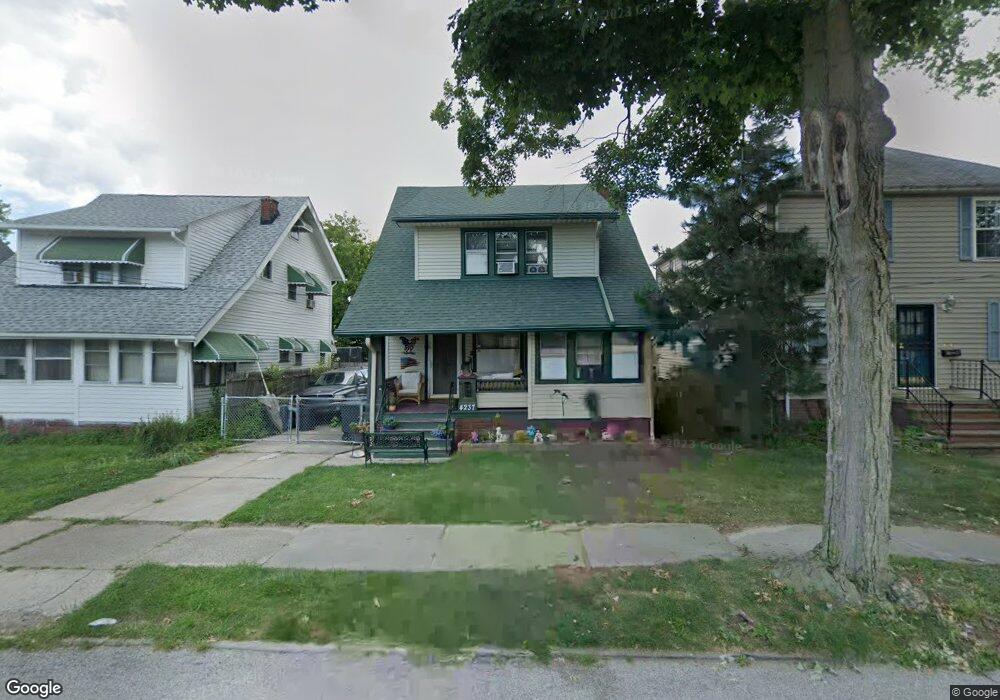
4237 W 23rd St Cleveland, OH 44109
Old Brooklyn NeighborhoodEstimated Value: $139,588 - $170,000
3
Beds
1
Bath
1,406
Sq Ft
$108/Sq Ft
Est. Value
About This Home
This home is located at 4237 W 23rd St, Cleveland, OH 44109 and is currently estimated at $151,147, approximately $107 per square foot. 4237 W 23rd St is a home located in Cuyahoga County with nearby schools including Benjamin Franklin, Almira Academy, and Anton Grdina School.
Ownership History
Date
Name
Owned For
Owner Type
Purchase Details
Closed on
Nov 24, 1999
Sold by
Harkay Attila A and Harkay Sherry D
Bought by
Harkay Sherry D
Current Estimated Value
Home Financials for this Owner
Home Financials are based on the most recent Mortgage that was taken out on this home.
Original Mortgage
$22,290
Interest Rate
7.57%
Mortgage Type
FHA
Purchase Details
Closed on
Dec 27, 1988
Sold by
Macasek Greg
Bought by
Harkay Attila A
Purchase Details
Closed on
May 17, 1988
Bought by
Macasek Greg
Purchase Details
Closed on
Jan 25, 1988
Sold by
Loudenback Gary V
Bought by
Secretary Of H U D
Purchase Details
Closed on
Dec 23, 1985
Sold by
Schlott Joseph C
Bought by
Loudenback Gary
Purchase Details
Closed on
Dec 28, 1984
Sold by
Brayer Corey G
Bought by
Schlott Joseph C
Purchase Details
Closed on
Nov 3, 1978
Sold by
Schack William J and Schack Patricia
Bought by
Brayer Corey G
Purchase Details
Closed on
Jan 1, 1975
Bought by
Schack William J and Schack Patricia
Create a Home Valuation Report for This Property
The Home Valuation Report is an in-depth analysis detailing your home's value as well as a comparison with similar homes in the area
Home Values in the Area
Average Home Value in this Area
Purchase History
| Date | Buyer | Sale Price | Title Company |
|---|---|---|---|
| Harkay Sherry D | -- | -- | |
| Harkay Attila A | $46,200 | -- | |
| Macasek Greg | -- | -- | |
| Secretary Of H U D | -- | -- | |
| Loudenback Gary | $42,000 | -- | |
| Schlott Joseph C | $35,500 | -- | |
| Brayer Corey G | $37,000 | -- | |
| Schack William J | -- | -- |
Source: Public Records
Mortgage History
| Date | Status | Borrower | Loan Amount |
|---|---|---|---|
| Closed | Harkay Sherry D | $22,290 |
Source: Public Records
Tax History Compared to Growth
Tax History
| Year | Tax Paid | Tax Assessment Tax Assessment Total Assessment is a certain percentage of the fair market value that is determined by local assessors to be the total taxable value of land and additions on the property. | Land | Improvement |
|---|---|---|---|---|
| 2024 | $2,618 | $39,935 | $7,840 | $32,095 |
| 2023 | $1,822 | $24,020 | $5,430 | $18,590 |
| 2022 | $1,811 | $24,010 | $5,430 | $18,590 |
| 2021 | $1,793 | $24,010 | $5,430 | $18,590 |
| 2020 | $1,608 | $18,620 | $4,200 | $14,420 |
| 2019 | $1,487 | $53,200 | $12,000 | $41,200 |
| 2018 | $1,456 | $18,620 | $4,200 | $14,420 |
| 2017 | $1,443 | $17,500 | $3,290 | $14,210 |
| 2016 | $1,432 | $17,500 | $3,290 | $14,210 |
| 2015 | $1,596 | $17,500 | $3,290 | $14,210 |
| 2014 | $1,596 | $19,430 | $3,640 | $15,790 |
Source: Public Records
Map
Nearby Homes
- 4267 W 21st St
- 4226 Valley Rd
- 4295 W 30th St
- 4233 Valley Rd
- 2802 Colburn Ave
- 4302 W 30th St
- 2101 Broadview Rd
- 2312 Roanoke Ave Unit 1-2
- 1905 Creston Ave
- 4091 Valley Rd
- 1825 Treadway Ave
- 1703 Crestline Ave
- 1516 Amberley Ave
- 3529 Broadview Rd
- 1610 Crestline Ave
- 2219 Hood Ave
- 4491 W 30th St
- 1511 Crestline Ave
- 3613 Henritze Ave
- 2810 Natchez Ave