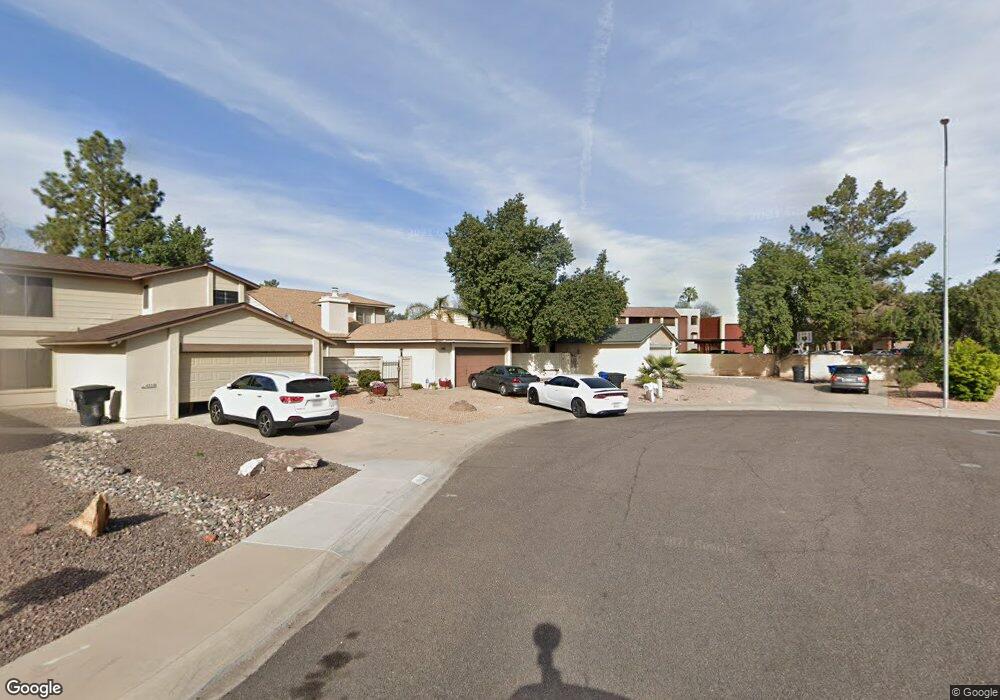
4238 E Caballero Cir Mesa, AZ 85205
The Groves NeighborhoodEstimated Value: $348,933 - $434,000
Studio
1
Bath
1,727
Sq Ft
$231/Sq Ft
Est. Value
About This Home
This home is located at 4238 E Caballero Cir, Mesa, AZ 85205 and is currently estimated at $399,233, approximately $231 per square foot. 4238 E Caballero Cir is a home located in Maricopa County with nearby schools including Entz Elementary School, Franklin at Brimhall Elementary School, and Franklin West Elementary School.
Ownership History
Date
Name
Owned For
Owner Type
Purchase Details
Closed on
Sep 13, 2010
Sold by
Merrill Jason Lawrence
Bought by
Merrill Kelly Sue
Current Estimated Value
Purchase Details
Closed on
Mar 28, 2002
Sold by
Maltby Darin M
Bought by
Merrill Jason Lawrence and Merrill Kelly Sue
Home Financials for this Owner
Home Financials are based on the most recent Mortgage that was taken out on this home.
Original Mortgage
$122,405
Outstanding Balance
$50,851
Interest Rate
6.84%
Mortgage Type
FHA
Estimated Equity
$348,382
Purchase Details
Closed on
Apr 21, 1997
Sold by
Roberto Cynthia Jean
Bought by
Maltby Darin M and Maltby Dianne
Home Financials for this Owner
Home Financials are based on the most recent Mortgage that was taken out on this home.
Original Mortgage
$106,186
Interest Rate
8.14%
Mortgage Type
FHA
Create a Home Valuation Report for This Property
The Home Valuation Report is an in-depth analysis detailing your home's value as well as a comparison with similar homes in the area
Home Values in the Area
Average Home Value in this Area
Purchase History
| Date | Buyer | Sale Price | Title Company |
|---|---|---|---|
| Merrill Kelly Sue | -- | None Available | |
| Merrill Jason Lawrence | $123,500 | Security Title Agency | |
| Maltby Darin M | $106,900 | Transnation Title Ins Co |
Source: Public Records
Mortgage History
| Date | Status | Borrower | Loan Amount |
|---|---|---|---|
| Open | Merrill Jason Lawrence | $122,405 | |
| Previous Owner | Maltby Darin M | $106,186 |
Source: Public Records
Tax History
| Year | Tax Paid | Tax Assessment Tax Assessment Total Assessment is a certain percentage of the fair market value that is determined by local assessors to be the total taxable value of land and additions on the property. | Land | Improvement |
|---|---|---|---|---|
| 2025 | $1,155 | $13,546 | -- | -- |
| 2024 | $1,167 | $12,901 | -- | -- |
| 2023 | $1,167 | $27,920 | $5,580 | $22,340 |
| 2022 | $1,142 | $21,510 | $4,300 | $17,210 |
| 2021 | $1,168 | $20,820 | $4,160 | $16,660 |
| 2020 | $1,152 | $17,060 | $3,410 | $13,650 |
| 2019 | $1,069 | $16,900 | $3,380 | $13,520 |
| 2018 | $1,019 | $15,660 | $3,130 | $12,530 |
| 2017 | $988 | $14,610 | $2,920 | $11,690 |
| 2016 | $969 | $14,150 | $2,830 | $11,320 |
| 2015 | $914 | $12,920 | $2,580 | $10,340 |
Source: Public Records
Map
Nearby Homes
- 4065 E University Dr Unit 157
- 4126 E Covina St
- 4335 E Contessa St
- 4065 E University Dr Unit 433
- 4065 E University Dr Unit 50
- 4065 E University Dr Unit 430
- 4065 E University Dr Unit 271
- 4065 E University Dr Unit 564
- 4065 E University Dr Unit 136
- 4065 E University Dr Unit 516
- 4065 E University Dr Unit 456
- 4065 E University Dr Unit 344
- 4065 E University Dr Unit 476
- 4065 E University Dr Unit 58
- 4065 E University Dr Unit 285
- 4065 E University Dr Unit 115
- 4065 E University Dr Unit 332
- 4065 E University Dr Unit 458
- 4065 E University Dr Unit 528
- 4065 E University Dr Unit 83
- 4230 E Caballero Cir
- 4222 E Caballero Cir
- 4214 E Caballero Cir
- 4221 E Camino St
- 4227 E Caballero Cir
- 4239 E Caballero Cir
- 421 N New Haven
- 4213 E Camino St
- 4231 E Caballero Cir
- 4212 E Caballero Cir
- 4219 E Caballero Cir
- 4223 E Caballero Cir
- 4215 E Caballero Cir
- 4211 E Camino St
- 427 N New Haven
- 427 N New Haven
- 4208 E Caballero Cir
- 4213 E Caballero Cir
- 4209 E Camino St
- 4211 E Caballero Cir
Your Personal Tour Guide
Ask me questions while you tour the home.