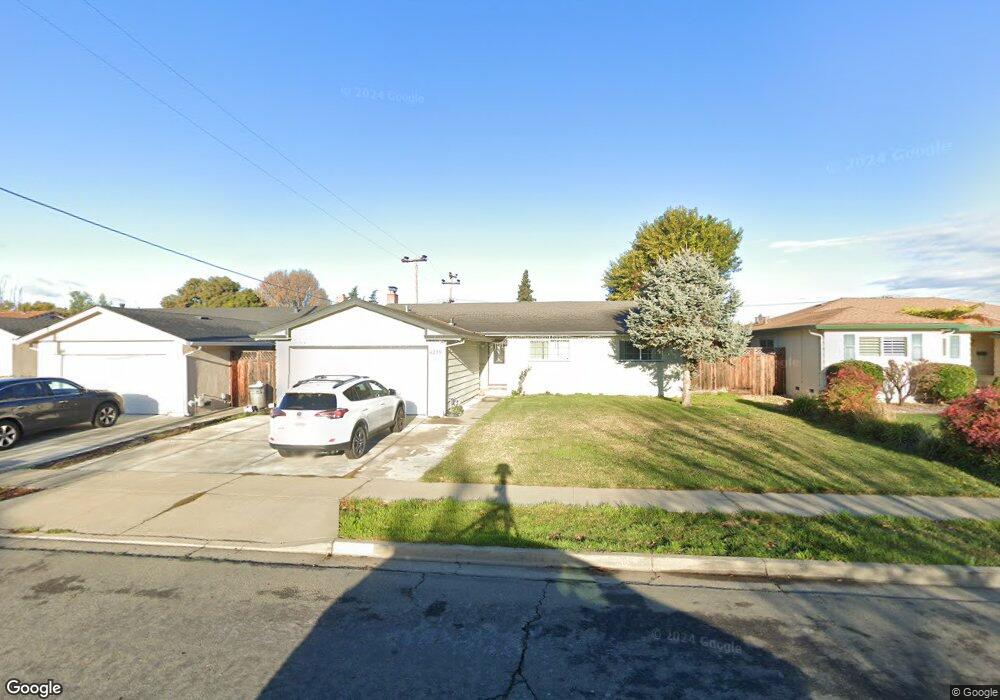
4239 Blue Ridge St Fremont, CA 94536
Estimated Value: $1,389,000 - $1,601,000
3
Beds
2
Baths
1,400
Sq Ft
$1,061/Sq Ft
Est. Value
About This Home
This home is located at 4239 Blue Ridge St, Fremont, CA 94536 and is currently estimated at $1,484,774, approximately $1,060 per square foot. 4239 Blue Ridge St is a home located in Alameda County with nearby schools including Oliveira Elementary School, Thornton Middle School, and American High School.
Ownership History
Date
Name
Owned For
Owner Type
Purchase Details
Closed on
May 31, 2024
Sold by
Wang Moses and Lu Xiaoling
Bought by
Mxcc Living Trust and Wang
Current Estimated Value
Purchase Details
Closed on
Aug 7, 2012
Sold by
Grover Saroj
Bought by
Grover Subhash
Home Financials for this Owner
Home Financials are based on the most recent Mortgage that was taken out on this home.
Original Mortgage
$345,750
Interest Rate
3.62%
Mortgage Type
New Conventional
Purchase Details
Closed on
Aug 3, 2012
Sold by
Grover Subhash
Bought by
Wang Moses and Lu Xiaoling
Home Financials for this Owner
Home Financials are based on the most recent Mortgage that was taken out on this home.
Original Mortgage
$345,750
Interest Rate
3.62%
Mortgage Type
New Conventional
Purchase Details
Closed on
Oct 6, 2011
Sold by
Household Finance Corporation Of Califor
Bought by
Grover Subhash
Purchase Details
Closed on
Jan 25, 2011
Sold by
Humphries Barbara A
Bought by
Household Finance Corporation Of Califor
Create a Home Valuation Report for This Property
The Home Valuation Report is an in-depth analysis detailing your home's value as well as a comparison with similar homes in the area
Home Values in the Area
Average Home Value in this Area
Purchase History
| Date | Buyer | Sale Price | Title Company |
|---|---|---|---|
| Mxcc Living Trust | -- | None Listed On Document | |
| Grover Subhash | -- | Chicago Title Company | |
| Wang Moses | $461,000 | Chicago Title Company | |
| Grover Subhash | $355,000 | Lsi Title Company | |
| Household Finance Corporation Of Califor | $443,040 | Accommodation |
Source: Public Records
Mortgage History
| Date | Status | Borrower | Loan Amount |
|---|---|---|---|
| Previous Owner | Wang Moses | $345,750 |
Source: Public Records
Tax History Compared to Growth
Tax History
| Year | Tax Paid | Tax Assessment Tax Assessment Total Assessment is a certain percentage of the fair market value that is determined by local assessors to be the total taxable value of land and additions on the property. | Land | Improvement |
|---|---|---|---|---|
| 2025 | $7,126 | $567,666 | $198,252 | $369,414 |
| 2024 | $7,126 | $556,537 | $194,365 | $362,172 |
| 2023 | $6,928 | $545,625 | $190,554 | $355,071 |
| 2022 | $6,829 | $534,930 | $186,819 | $348,111 |
| 2021 | $6,665 | $524,442 | $183,156 | $341,286 |
| 2020 | $6,650 | $519,067 | $181,279 | $337,788 |
| 2019 | $6,576 | $508,893 | $177,726 | $331,167 |
| 2018 | $6,447 | $498,917 | $174,242 | $324,675 |
| 2017 | $6,287 | $489,134 | $170,825 | $318,309 |
| 2016 | $6,176 | $479,546 | $167,477 | $312,069 |
| 2015 | $6,089 | $472,345 | $164,962 | $307,383 |
| 2014 | $5,982 | $463,092 | $161,730 | $301,362 |
Source: Public Records
Map
Nearby Homes
- 4412 Elaiso Common
- 4543 Bartolo Terrace
- 37001 Contra Costa Ave
- 36922 Bolina Terrace
- 4544 Thornton Ave
- 4632 Balboa Way
- 3663 Oakwood Terrace Unit 211
- 4637 Rothbury Common
- 3530 Oakwood Terrace Unit 102
- 36992 Meadowbrook Common Unit 102
- 3371 Baywood Terrace Unit 214
- 36304 Magellan Dr
- 3402 Pinewood Terrace Unit 211
- 4251 Nicolet Ave
- 36347 Magellan Dr
- 3416 Deerwood Terrace Unit 113
- 3443 Pepperwood Terrace Unit 301
- 3507 Buttonwood Terrace Unit 203
- 3100 Mackenzie Place
- 4626 Alhambra Dr
- 4231 Blue Ridge St
- 4247 Blue Ridge St
- 4255 Blue Ridge St
- 4223 Blue Ridge St
- 4234 Blue Ridge St
- 4263 Blue Ridge St
- 4250 Blue Ridge St
- 4215 Blue Ridge St
- 36803 Oak St
- 4258 Blue Ridge St
- 4207 Blue Ridge St
- 36819 Oak St
- 4271 Blue Ridge St
- 4264 Blue Ridge St
- 36753 Oak St
- 36835 Oak St
- 4279 Blue Ridge St
- 4263 Dallas Ct
- 36804 Dauphine Ave
- 36717 Oak St