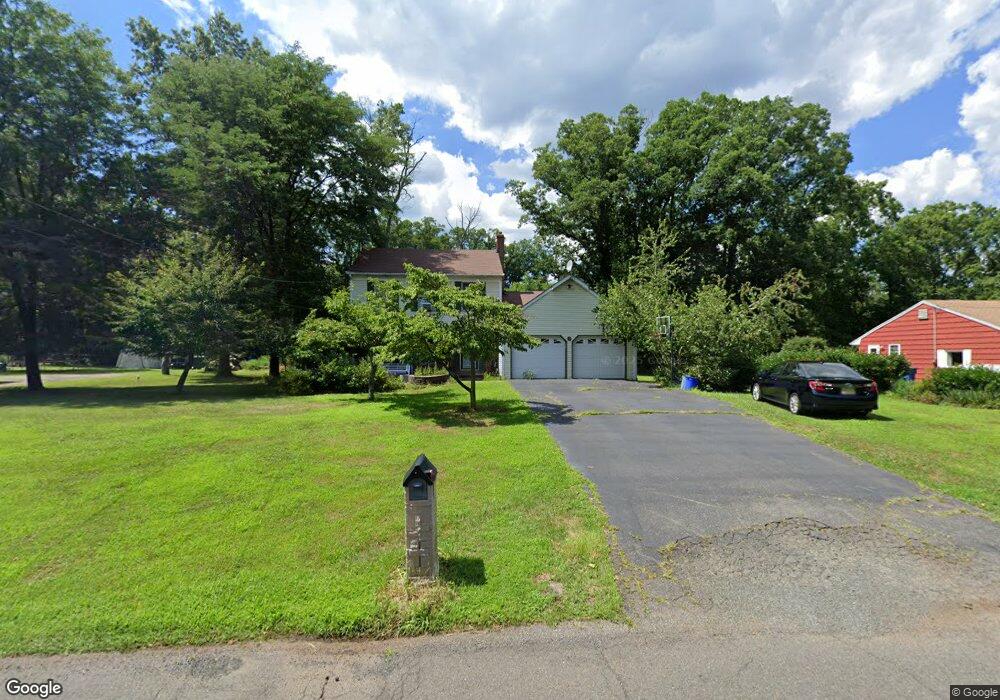
424 2nd Ave Piscataway, NJ 08854
Estimated Value: $632,000 - $787,000
--
Bed
--
Bath
1,608
Sq Ft
$418/Sq Ft
Est. Value
About This Home
This home is located at 424 2nd Ave, Piscataway, NJ 08854 and is currently estimated at $672,255, approximately $418 per square foot. 424 2nd Ave is a home located in Middlesex County with nearby schools including Martin Luther King Intermediate School, Randolphville Elementary School, and Conackamack Middle School.
Ownership History
Date
Name
Owned For
Owner Type
Purchase Details
Closed on
Mar 4, 2016
Sold by
Vanvantran Hung Van and Tran Aitam Thi
Bought by
Vanvantran Hung Van and Tran Aitam Thi
Current Estimated Value
Purchase Details
Closed on
Aug 7, 1995
Sold by
Maehr David
Bought by
Vantran Hung and Nguyen Aitam Thi
Home Financials for this Owner
Home Financials are based on the most recent Mortgage that was taken out on this home.
Original Mortgage
$153,000
Interest Rate
7.48%
Create a Home Valuation Report for This Property
The Home Valuation Report is an in-depth analysis detailing your home's value as well as a comparison with similar homes in the area
Home Values in the Area
Average Home Value in this Area
Purchase History
| Date | Buyer | Sale Price | Title Company |
|---|---|---|---|
| Vanvantran Hung Van | -- | Equity National Title And Cl | |
| Vantran Hung | $202,500 | -- |
Source: Public Records
Mortgage History
| Date | Status | Borrower | Loan Amount |
|---|---|---|---|
| Closed | Vantran Hung | $153,000 |
Source: Public Records
Tax History Compared to Growth
Tax History
| Year | Tax Paid | Tax Assessment Tax Assessment Total Assessment is a certain percentage of the fair market value that is determined by local assessors to be the total taxable value of land and additions on the property. | Land | Improvement |
|---|---|---|---|---|
| 2025 | $9,580 | $568,500 | $352,000 | $216,500 |
| 2024 | $9,493 | $489,500 | $227,100 | $262,400 |
| 2023 | $9,493 | $454,200 | $227,100 | $227,100 |
| 2022 | $8,778 | $389,800 | $227,100 | $162,700 |
| 2021 | $8,260 | $352,700 | $207,100 | $145,600 |
| 2020 | $8,069 | $345,400 | $207,100 | $138,300 |
| 2019 | $8,207 | $345,400 | $207,100 | $138,300 |
| 2018 | $7,998 | $337,200 | $207,100 | $130,100 |
| 2017 | $7,990 | $291,500 | $172,100 | $119,400 |
| 2016 | $7,841 | $291,500 | $172,100 | $119,400 |
| 2015 | $7,731 | $291,500 | $172,100 | $119,400 |
| 2014 | $7,556 | $291,500 | $172,100 | $119,400 |
Source: Public Records
Map
Nearby Homes