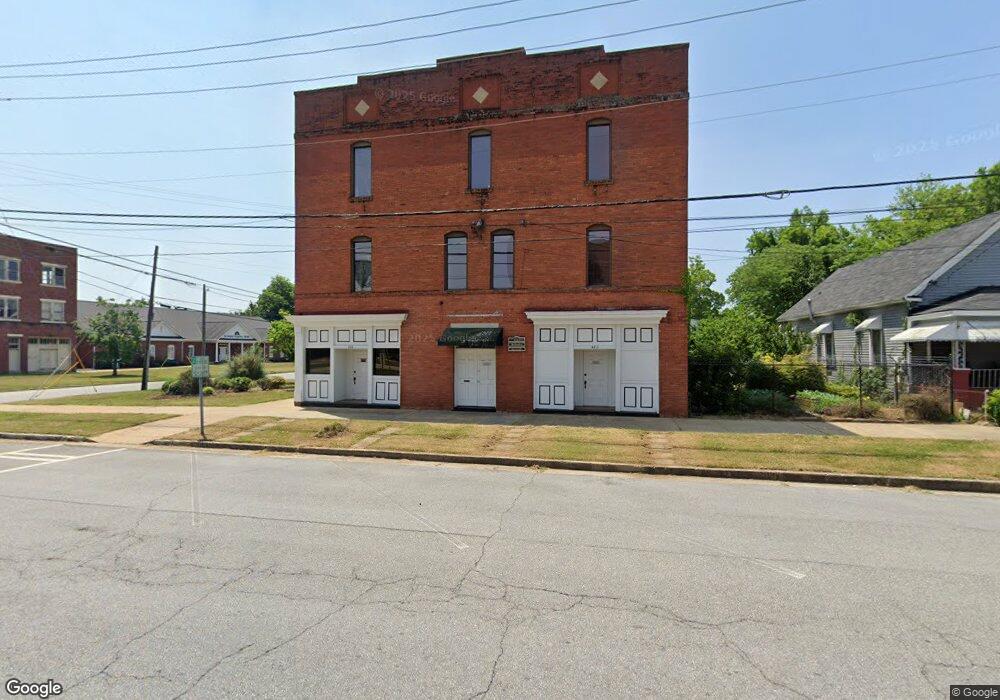
424 9th St Columbus, GA 31901
Downtown Columbus NeighborhoodEstimated Value: $122,970
Studio
1
Bath
3,600
Sq Ft
$34/Sq Ft
Est. Value
About This Home
This home is located at 424 9th St, Columbus, GA 31901 and is currently estimated at $122,970, approximately $34 per square foot. 424 9th St is a home located in Muscogee County with nearby schools including Davis Elementary School, Double Churches Middle School, and Jordan Vocational High School.
Ownership History
Date
Name
Owned For
Owner Type
Purchase Details
Closed on
Oct 12, 2012
Sold by
Odom William Samuel
Bought by
Lunsford Joseph M
Current Estimated Value
Home Financials for this Owner
Home Financials are based on the most recent Mortgage that was taken out on this home.
Original Mortgage
$182,500
Interest Rate
3.6%
Create a Home Valuation Report for This Property
The Home Valuation Report is an in-depth analysis detailing your home's value as well as a comparison with similar homes in the area
Home Values in the Area
Average Home Value in this Area
Purchase History
| Date | Buyer | Sale Price | Title Company |
|---|---|---|---|
| Lunsford Joseph M | $65,000 | -- |
Source: Public Records
Mortgage History
| Date | Status | Borrower | Loan Amount |
|---|---|---|---|
| Closed | Lunsford Joseph M | $182,500 |
Source: Public Records
Tax History
| Year | Tax Paid | Tax Assessment Tax Assessment Total Assessment is a certain percentage of the fair market value that is determined by local assessors to be the total taxable value of land and additions on the property. | Land | Improvement |
|---|---|---|---|---|
| 2025 | $240 | $61,216 | $23,524 | $37,692 |
| 2024 | $240 | $61,216 | $23,524 | $37,692 |
| 2023 | $2,411 | $61,216 | $23,524 | $37,692 |
| 2022 | $2,238 | $54,807 | $23,524 | $31,283 |
| 2021 | $2,071 | $50,728 | $23,524 | $27,204 |
| 2020 | $2,072 | $50,728 | $23,524 | $27,204 |
| 2019 | $2,078 | $50,728 | $23,524 | $27,204 |
| 2018 | $2,371 | $50,728 | $23,524 | $27,204 |
| 2017 | $2,085 | $50,728 | $23,524 | $27,204 |
| 2016 | $2,069 | $50,149 | $13,304 | $36,845 |
| 2015 | $828 | $50,149 | $13,304 | $36,845 |
| 2014 | $2,074 | $50,149 | $13,304 | $36,845 |
| 2013 | -- | $50,149 | $13,304 | $36,845 |
Source: Public Records
Map
Nearby Homes
- 811 3rd Ave
- 816 2nd Ave
- 804 2nd Ave
- 731 2nd Ave
- 717 1st Ave
- 715 1st Ave
- 731 Broadway
- 715 Broadway
- Lots 1-8 3rd Ave
- 404 3rd Ave
- 508 3rd Ave
- 1204 1st Ave Unit 303
- 102 5th St
- 1103 Martin Luther King Junior Blvd
- 1201 Front Ave Unit 304
- 1201 Front Ave Unit 507
- 1201 Front Ave Unit 203
- 1201 Front Ave Unit 222
- 1201 Front Ave Unit 216
- 912 Magnolia Ave
Your Personal Tour Guide
Ask me questions while you tour the home.