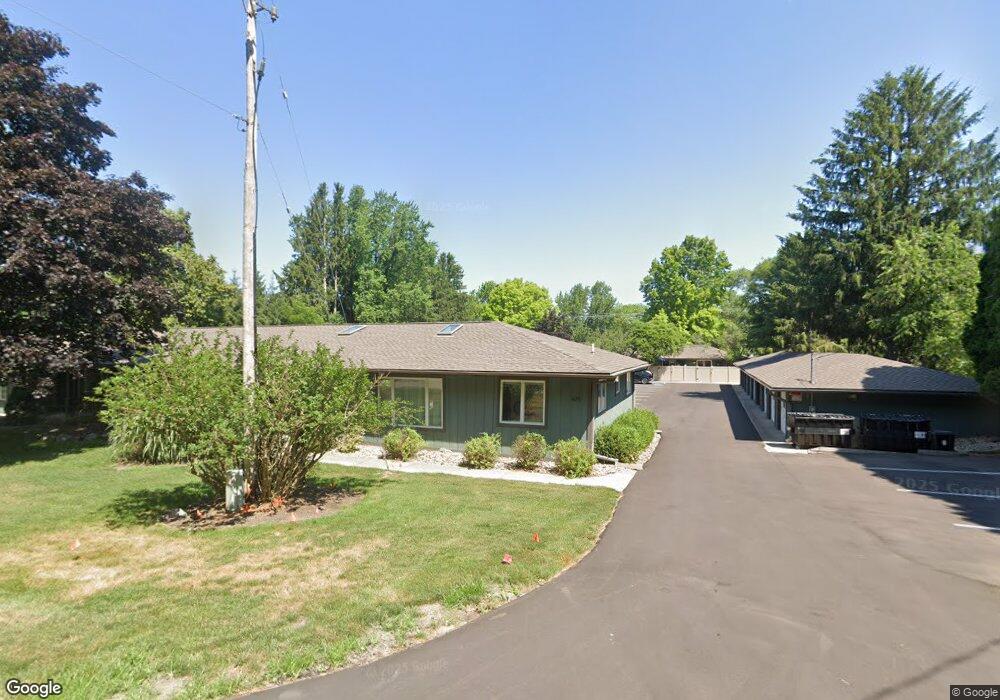
424 Fremont St Unit 9 Douglas, MI 49406
Estimated Value: $357,000 - $441,000
2
Beds
1
Bath
901
Sq Ft
$441/Sq Ft
Est. Value
About This Home
This home is located at 424 Fremont St Unit 9, Douglas, MI 49406 and is currently estimated at $397,208, approximately $440 per square foot. 424 Fremont St Unit 9 is a home located in Allegan County with nearby schools including Douglas Elementary School, Saugatuck Middle School, and Saugatuck High School.
Ownership History
Date
Name
Owned For
Owner Type
Purchase Details
Closed on
Nov 21, 2013
Sold by
Rebb Robert K and Molnar Christopher E
Bought by
Pezok Michael J and Pezok Karen J
Current Estimated Value
Home Financials for this Owner
Home Financials are based on the most recent Mortgage that was taken out on this home.
Original Mortgage
$100,000
Outstanding Balance
$73,497
Interest Rate
3.87%
Mortgage Type
Adjustable Rate Mortgage/ARM
Estimated Equity
$323,711
Purchase Details
Closed on
Mar 17, 2005
Sold by
Stevens Dan J and Stevens Daniel J
Bought by
Rebb Robert K and Molnar Christopher E
Home Financials for this Owner
Home Financials are based on the most recent Mortgage that was taken out on this home.
Original Mortgage
$138,800
Interest Rate
5.64%
Mortgage Type
Purchase Money Mortgage
Purchase Details
Closed on
Oct 1, 2004
Sold by
Earl Timothy J and Vandenberg Jean A
Bought by
Way Michael S and Way Kathleen J
Purchase Details
Closed on
Apr 28, 2004
Sold by
Center Park Place Development Llc
Bought by
Stevens Dan J
Home Financials for this Owner
Home Financials are based on the most recent Mortgage that was taken out on this home.
Original Mortgage
$135,900
Interest Rate
5.85%
Mortgage Type
Balloon
Create a Home Valuation Report for This Property
The Home Valuation Report is an in-depth analysis detailing your home's value as well as a comparison with similar homes in the area
Home Values in the Area
Average Home Value in this Area
Purchase History
| Date | Buyer | Sale Price | Title Company |
|---|---|---|---|
| Pezok Michael J | $125,000 | Homeowners Title Agency | |
| Rebb Robert K | $172,500 | Lighthouse Title Inc | |
| Way Michael S | $160,000 | Metropolitan Title Company | |
| Stevens Dan J | $151,000 | Metropolitan Title Company |
Source: Public Records
Mortgage History
| Date | Status | Borrower | Loan Amount |
|---|---|---|---|
| Open | Pezok Michael J | $100,000 | |
| Previous Owner | Rebb Robert K | $138,800 | |
| Previous Owner | Stevens Dan J | $135,900 |
Source: Public Records
Tax History Compared to Growth
Tax History
| Year | Tax Paid | Tax Assessment Tax Assessment Total Assessment is a certain percentage of the fair market value that is determined by local assessors to be the total taxable value of land and additions on the property. | Land | Improvement |
|---|---|---|---|---|
| 2025 | $4,454 | $133,400 | $31,000 | $102,400 |
| 2024 | -- | $122,500 | $31,000 | $91,500 |
| 2023 | $4,180 | $98,900 | $31,000 | $67,900 |
| 2022 | $4,036 | $82,100 | $30,000 | $52,100 |
| 2021 | $5,415 | $80,500 | $30,000 | $50,500 |
| 2020 | $3,722 | $80,600 | $30,000 | $50,600 |
| 2019 | $0 | $74,500 | $30,000 | $44,500 |
| 2018 | $0 | $71,800 | $30,000 | $41,800 |
| 2017 | $0 | $71,400 | $30,000 | $41,400 |
| 2016 | $0 | $67,100 | $30,000 | $37,100 |
| 2015 | -- | $67,100 | $30,000 | $37,100 |
| 2014 | -- | $59,000 | $30,000 | $29,000 |
| 2013 | -- | $58,400 | $30,000 | $28,400 |
Source: Public Records
Map
Nearby Homes
- 424 Fremont St Unit 6
- 389 W Center St Unit 1,2,3
- 387 Fremont St
- 355 Beachwood Way Unit 13
- 343 Beachwood Way Unit 12
- 327 Beachwood Way Unit 14
- 319 Beachwood Way Unit 15
- 287 Beachwood Way Unit 19
- 311 Beachwood Way Unit 16
- 295 Beachwood Way Unit 18
- 303 Beachwood Way Unit 17
- 134 Saint Peters Dr Unit 6
- 166 Saint Peters Dr Unit 2
- 150 Saint Peters Dr Unit 4
- 158 Saint Peters Dr Unit 3
- 142 Saint Peters Dr Unit 5
- 174 Saint Peters Dr Unit 1
- 212 W Randolph St
- 43 Ellis St
- 478 Amity St
- 424 Fremont St Unit 8
- 438 Fremont St
- 404 Fremont St
- 403 Center St
- 423 Center St Unit 1
- 447 Center St
- 392 Helmer St
- 393 Fremont St
- 461 Fremont St
- 385 Fremont St
- 453 Center St
- 4246 Fremont St
- 4247 Fremont St
- 4248 Fremont St
- 0 Fremont St
- 389 Center St
- 319 Ferry St
- 88 Ferry St Unit 3
- 318 Ferry St
- 10 Ferry St