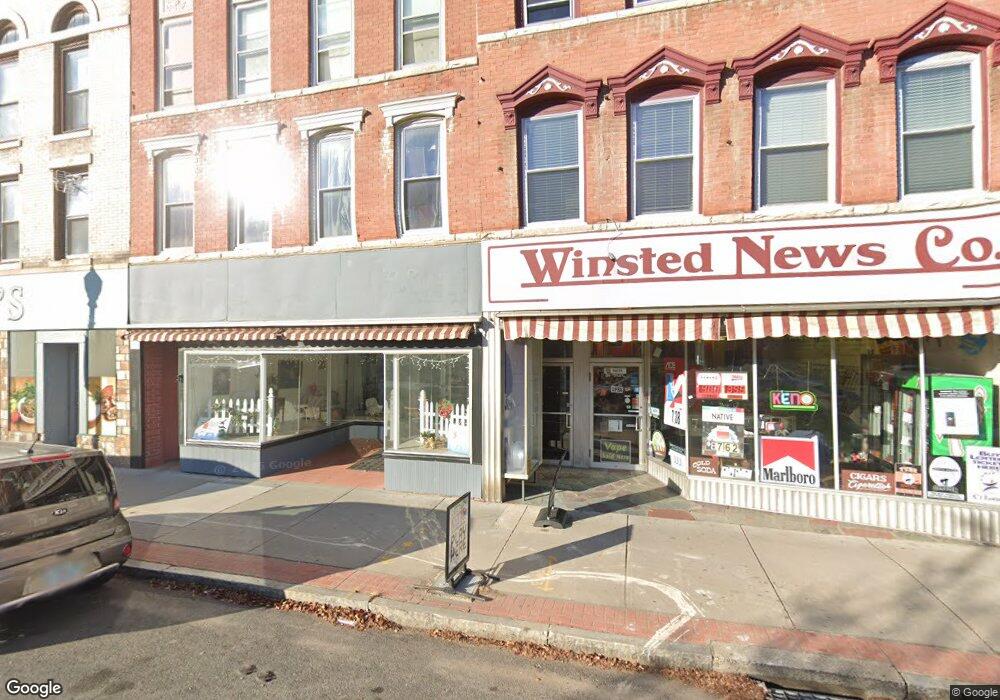
424 Main St Winsted, CT 06098
Estimated Value: $566,947
--
Bed
--
Bath
5,417
Sq Ft
$105/Sq Ft
Est. Value
About This Home
This home is located at 424 Main St, Winsted, CT 06098 and is currently priced at $566,947, approximately $104 per square foot. 424 Main St is a home located in Litchfield County with nearby schools including Explorations Charter School.
Ownership History
Date
Name
Owned For
Owner Type
Purchase Details
Closed on
Dec 29, 2020
Sold by
Watertown Town Of
Bought by
424 Main Llc
Current Estimated Value
Purchase Details
Closed on
Apr 1, 1973
Bought by
Ritchie Martin C
Create a Home Valuation Report for This Property
The Home Valuation Report is an in-depth analysis detailing your home's value as well as a comparison with similar homes in the area
Home Values in the Area
Average Home Value in this Area
Purchase History
| Date | Buyer | Sale Price | Title Company |
|---|---|---|---|
| 424 Main Llc | $405,000 | None Available | |
| Ritchie Martin C | -- | -- |
Source: Public Records
Tax History Compared to Growth
Tax History
| Year | Tax Paid | Tax Assessment Tax Assessment Total Assessment is a certain percentage of the fair market value that is determined by local assessors to be the total taxable value of land and additions on the property. | Land | Improvement |
|---|---|---|---|---|
| 2025 | $5,446 | $186,690 | $18,200 | $168,490 |
| 2024 | $5,085 | $186,690 | $18,200 | $168,490 |
| 2023 | $4,927 | $186,690 | $18,200 | $168,490 |
| 2022 | $4,390 | $130,900 | $16,240 | $114,660 |
| 2021 | $4,390 | $130,900 | $16,240 | $114,660 |
| 2020 | $4,390 | $130,900 | $16,240 | $114,660 |
| 2019 | $4,390 | $130,900 | $16,240 | $114,660 |
| 2018 | $4,390 | $130,900 | $16,240 | $114,660 |
| 2017 | $4,496 | $134,050 | $23,240 | $110,810 |
| 2016 | $4,496 | $134,050 | $23,240 | $110,810 |
| 2015 | $4,383 | $134,050 | $23,240 | $110,810 |
| 2014 | $4,278 | $134,050 | $23,240 | $110,810 |
Source: Public Records
Map
Nearby Homes