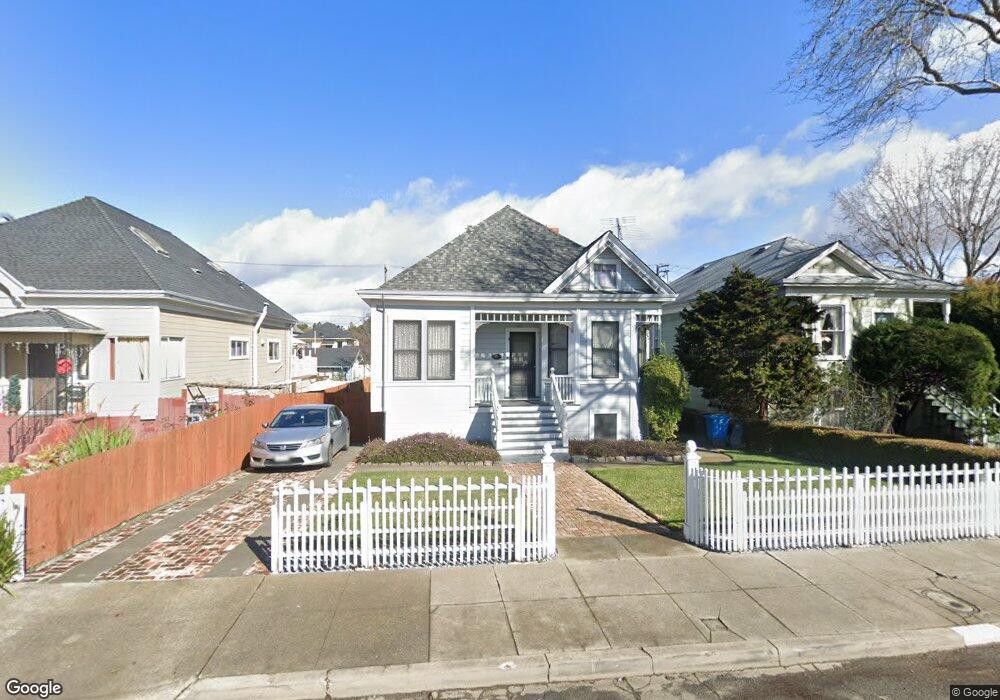
424 Ohio St Vallejo, CA 94590
Saint Vincent's Hill NeighborhoodEstimated Value: $365,000 - $435,000
2
Beds
1
Bath
1,052
Sq Ft
$375/Sq Ft
Est. Value
About This Home
This home is located at 424 Ohio St, Vallejo, CA 94590 and is currently estimated at $394,939, approximately $375 per square foot. 424 Ohio St is a home located in Solano County with nearby schools including Mare Island Health And Fitness Academy, Vallejo High School, and Caliber: ChangeMakers Academy.
Ownership History
Date
Name
Owned For
Owner Type
Purchase Details
Closed on
Feb 15, 1996
Sold by
Emc Mtg Corp
Bought by
Traub Jeremy
Current Estimated Value
Home Financials for this Owner
Home Financials are based on the most recent Mortgage that was taken out on this home.
Original Mortgage
$60,000
Interest Rate
6.55%
Purchase Details
Closed on
Nov 13, 1995
Sold by
Great Western Bank
Bought by
Emc Mtg Corp
Purchase Details
Closed on
Sep 26, 1995
Sold by
Foley Andrew W and Foley Karen L
Bought by
Great Western Bank
Create a Home Valuation Report for This Property
The Home Valuation Report is an in-depth analysis detailing your home's value as well as a comparison with similar homes in the area
Home Values in the Area
Average Home Value in this Area
Purchase History
We collect this data history from publicly available records. To have your information removed, we recommend requesting removal directly through your county’s website.
| Date | Buyer | Sale Price | Title Company |
|---|---|---|---|
| Traub Jeremy | $75,000 | Chicago Title Co | |
| Emc Mtg Corp | $41,545 | -- | |
| Great Western Bank | $66,022 | North American Title Co |
Source: Public Records
Mortgage History
We collect this data history from publicly available records. To have your information removed, we recommend requesting removal directly through your county’s website.
| Date | Status | Borrower | Loan Amount |
|---|---|---|---|
| Closed | Traub Jeremy | $60,000 |
Source: Public Records
Tax History
| Year | Tax Paid | Tax Assessment Tax Assessment Total Assessment is a certain percentage of the fair market value that is determined by local assessors to be the total taxable value of land and additions on the property. | Land | Improvement |
|---|---|---|---|---|
| 2025 | $2,510 | $124,591 | $49,835 | $74,756 |
| 2024 | $2,510 | $122,149 | $48,858 | $73,291 |
| 2023 | $2,323 | $119,754 | $47,900 | $71,854 |
| 2022 | $2,214 | $117,407 | $46,962 | $70,445 |
| 2021 | $2,163 | $115,106 | $46,042 | $69,064 |
| 2020 | $2,152 | $113,926 | $45,570 | $68,356 |
| 2019 | $2,066 | $111,693 | $44,677 | $67,016 |
| 2018 | $1,921 | $109,503 | $43,801 | $65,702 |
| 2017 | $1,816 | $107,357 | $42,943 | $64,414 |
| 2016 | $1,245 | $105,252 | $42,101 | $63,151 |
| 2015 | $1,229 | $103,672 | $41,469 | $62,203 |
| 2014 | $1,212 | $101,642 | $40,657 | $60,985 |
Source: Public Records
Map
Nearby Homes
- 432 Ohio St
- 1009 Sacramento St
- 2104 Marin St
- 1821 Marin St
- 908 Kentucky St
- 902 Kentucky St
- 314 Ohio St
- 230 Carolina St
- 1511 Marin St
- 219 Florida St
- 729 Ohio St
- 150 Florida St
- 318 Butte St
- 46 Alabama St
- 5 Santa Paula Way
- 734 Florida St
- 1322 Sutter St
- 1524 Sutter St
- 22 Saint Francis Dr
- 124 Illinois St
- 1107 Sacramento St
- 1103 Sacramento St
- 1109 Sacramento St
- 435 Ohio St
- 414 Ohio St
- 437 Ohio St
- 433 Louisiana St
- 1025 Sacramento St
- 433 Ohio St
- 427 Louisiana St
- 427 Ohio St
- 412 Ohio St
- 419 Ohio St
- 1015 Sacramento St
- 1023 Sacramento St
- 435 Louisiana St
- 415 Ohio St
- 502 Ohio St
- 407 Ohio St
- 400 Ohio St Unit ABC
Your Personal Tour Guide
Ask me questions while you tour the home.