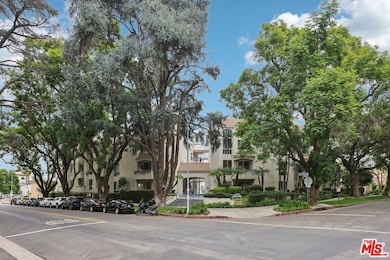
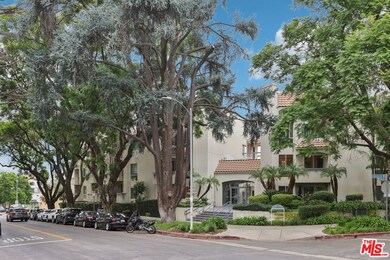
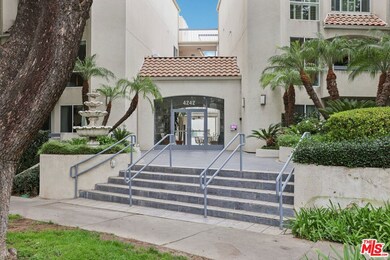
4242 Stansbury Ave Unit 104 Sherman Oaks, CA 91423
Estimated payment $5,193/month
Highlights
- In Ground Pool
- Primary Bedroom Suite
- View of Trees or Woods
- Ulysses S. Grant Senior High School Rated A-
- Gated Parking
- 0.66 Acre Lot
About This Home
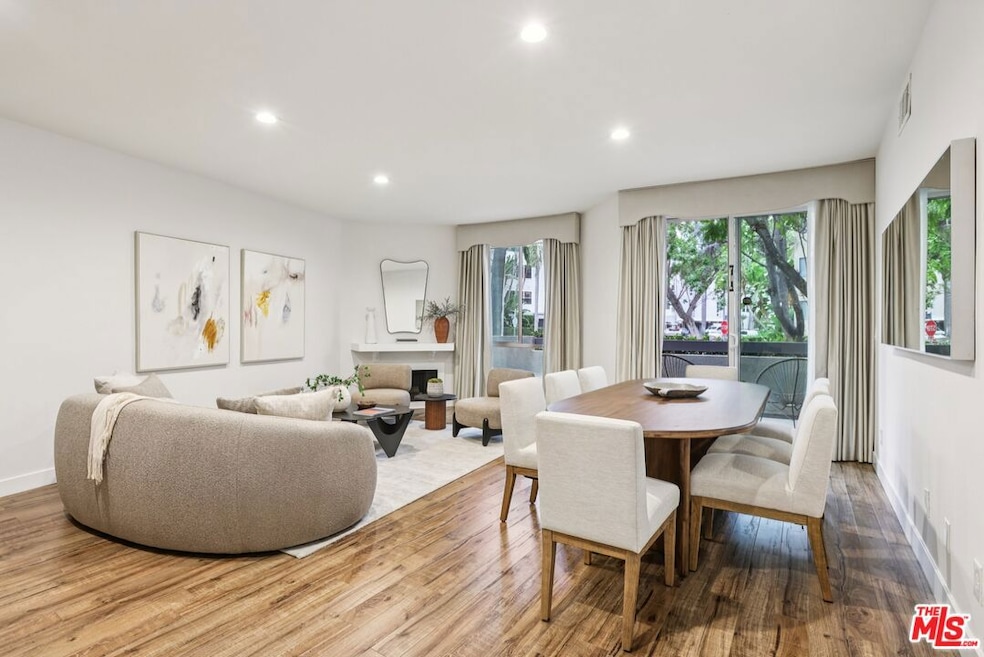
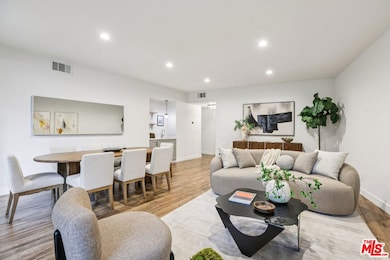
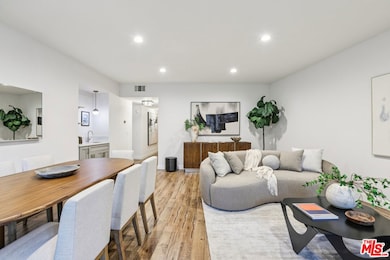
Experience the best of South of the BLVD Sherman Oaks living in this beautifully remodeled, contemporary 2-bedroom, 2-bath condo, ideally situated on a charming tree-lined street. Modern style meets timeless design in this light-filled home featuring an open floor plan with a spacious living and dining area, accented by a decorative fireplace and elegant finishes throughout. The new chef's eat-in kitchen is a show stopper, complete with beautiful countertops, beveled subway tile backsplash, sleek porcelain tile floors, a cozy breakfast nook, and new stainless-steel appliances. The primary suite offers a serene retreat with ample closets and a fully remodeled en-suite bathroom boasting a custom walk-in shower with glass doors, dual vanities, and stylish tile floors. The second bedroom and updated guest bath provide flexibility for guests, a home office, or creative space. Perfectly located just moments from premier shopping, dining, and entertainment along Ventura Blvd., this home blends modern luxury with everyday convenience. Welcome home to the heart of Sherman Oaks, where style, comfort, and location meet.
Property Details
Home Type
- Condominium
Est. Annual Taxes
- $8,456
Year Built
- Built in 1975 | Remodeled
Lot Details
- West Facing Home
- Gated Home
HOA Fees
- $875 Monthly HOA Fees
Parking
- 2 Car Garage
- Side by Side Parking
- Gated Parking
Home Design
- Traditional Architecture
- Entry on the 1st floor
- Turnkey
Interior Spaces
- 1,239 Sq Ft Home
- 3-Story Property
- Open Floorplan
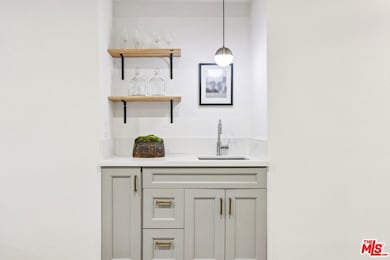
- Wet Bar
- Built-In Features
- High Ceiling
- Recessed Lighting
- Drapes & Rods
- Entryway
- Living Room with Fireplace
- Dining Room
- Views of Woods
Kitchen
- Oven
- Electric Cooktop
- Range Hood
- Dishwasher
- Disposal
Flooring
- Wood
- Tile
Bedrooms and Bathrooms
- 2 Bedrooms
- Main Floor Bedroom
- Primary Bedroom Suite
- Remodeled Bathroom
- 2 Full Bathrooms
- Double Vanity
- Bathtub with Shower
- Shower Only
Laundry
- Laundry in unit
- Dryer
- Washer
Home Security
Outdoor Features
- In Ground Pool
- Living Room Balcony
- Open Patio
Utilities
- Central Heating and Cooling System
- Property is located within a water district
Listing and Financial Details
- Assessor Parcel Number 2266-013-030
Community Details
Overview
- 30 Units
Amenities
- Elevator
Recreation
- Community Pool
Pet Policy
- Pets Allowed
Security
- Controlled Access
- Carbon Monoxide Detectors
- Fire and Smoke Detector
Map
Home Values in the Area
Average Home Value in this Area
Tax History
| Year | Tax Paid | Tax Assessment Tax Assessment Total Assessment is a certain percentage of the fair market value that is determined by local assessors to be the total taxable value of land and additions on the property. | Land | Improvement |
|---|---|---|---|---|
| 2025 | $8,456 | $712,503 | $491,481 | $221,022 |
| 2024 | $8,456 | $698,534 | $481,845 | $216,689 |
| 2023 | $8,290 | $684,839 | $472,398 | $212,441 |
| 2022 | $7,898 | $671,412 | $463,136 | $208,276 |
| 2021 | $7,798 | $658,248 | $454,055 | $204,193 |
| 2020 | $7,960 | $651,500 | $449,400 | $202,100 |
| 2019 | $6,101 | $507,500 | $310,700 | $196,800 |
| 2018 | $3,248 | $260,873 | $111,366 | $149,507 |
| 2016 | $3,094 | $250,745 | $107,043 | $143,702 |
| 2015 | $3,049 | $246,980 | $105,436 | $141,544 |
| 2014 | $3,065 | $242,143 | $103,371 | $138,772 |
Property History
| Date | Event | Price | List to Sale | Price per Sq Ft |
|---|---|---|---|---|
| 11/25/2025 11/25/25 | Pending | -- | -- | -- |
| 11/13/2025 11/13/25 | For Sale | $689,000 | -- | $556 / Sq Ft |
Purchase History
| Date | Type | Sale Price | Title Company |
|---|---|---|---|
| Grant Deed | $651,500 | Ticor Title | |
| Grant Deed | $507,500 | Ticor Title | |
| Grant Deed | $197,000 | Benefit Land Title Company | |
| Interfamily Deed Transfer | -- | -- | |
| Interfamily Deed Transfer | -- | -- |
Mortgage History
| Date | Status | Loan Amount | Loan Type |
|---|---|---|---|
| Open | $521,200 | New Conventional | |
| Previous Owner | $157,600 | No Value Available |
Source: The MLS
MLS Number: 25618495
APN: 2266-013-030
Disclaimer: Certain information contained herein is derived from information provided by parties other than Homes.com. All information provided is deemed reliable, but is not guaranteed to be accurate and should be independently verified.
![]() © 2025 The MLS™ - Combined L.A. Westside MLS (CLAW). All rights reserved. Based on information from The MLS™ - Combined L.A. Westside MLS (CLAW). All data, including all measurements and calculations of area, is obtained from various sources and has not been, and will not be, verified by broker or MLS. All information should be independently reviewed and verified for accuracy. Properties may or may not be listed by the office/agent presenting the information.
© 2025 The MLS™ - Combined L.A. Westside MLS (CLAW). All rights reserved. Based on information from The MLS™ - Combined L.A. Westside MLS (CLAW). All data, including all measurements and calculations of area, is obtained from various sources and has not been, and will not be, verified by broker or MLS. All information should be independently reviewed and verified for accuracy. Properties may or may not be listed by the office/agent presenting the information.
IDX information is provided exclusively for personal, non-commercial use, and may not be used for any purpose other than to identify prospective properties consumers may be interested in purchasing.
Information is deemed reliable but not guaranteed.
- 14144 Dickens St Unit 216
- 4230 Stansbury Ave Unit 105
- 14128 Dickens St
- 14106 Dickens St Unit 102
- 14106 Dickens St Unit 302
- 14235 Greenleaf St
- 14234 Dickens St Unit 2
- 14238 Dickens St Unit 4
- 4219 Costello Ave
- 14273 Greenleaf St
- 13948 Moorpark St Unit 4
- 14015 Roblar Rd
- 4437 Calhoun Ave
- 4447 Calhoun Ave
- 14332 Dickens St Unit 10
- 4334 Colbath Ave Unit 304
- 13920 Moorpark St Unit 201
- 4500 Calhoun Ave
- 4487 Colbath Ave Unit 207
- 4487 Colbath Ave Unit 101
