Estimated Value: $894,000 - $1,014,000
3
Beds
2
Baths
2,221
Sq Ft
$427/Sq Ft
Est. Value
About This Home
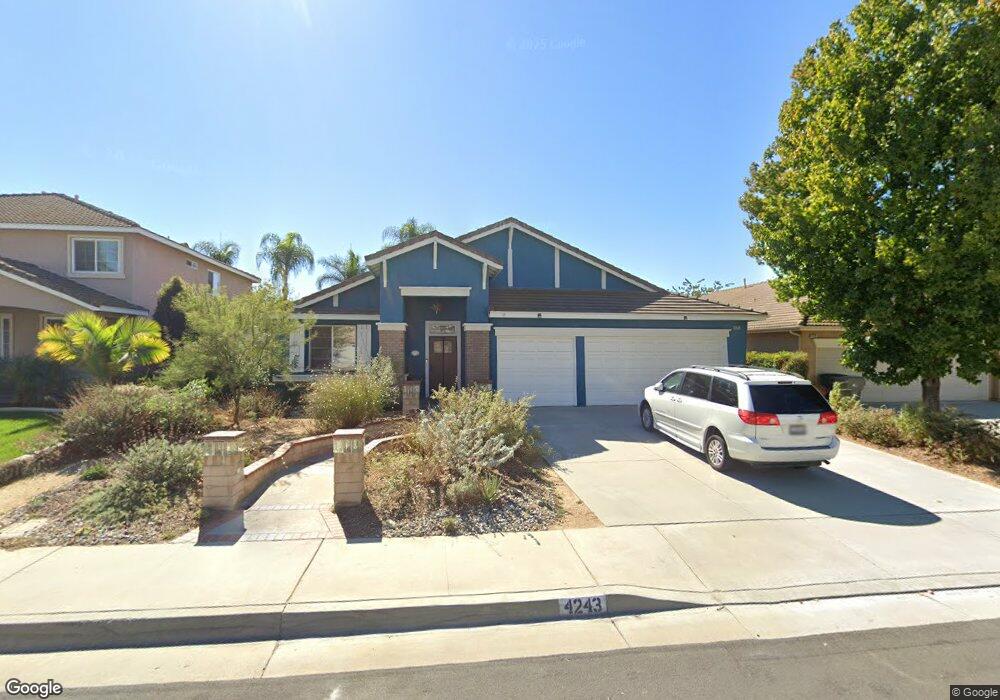
This home is located at 4243 Bryant St, Chino, CA 91710 and is currently estimated at $948,426, approximately $427 per square foot. 4243 Bryant St is a home located in San Bernardino County with nearby schools including Newman Elementary, Ramona Junior High School, and Don Antonio Lugo High School.
Ownership History
Date
Name
Owned For
Owner Type
Purchase Details
Closed on
Aug 18, 2010
Sold by
Calta Michael
Bought by
Gabriela Martinez Special Needs Trust and Wells Fargo Bank Na
Current Estimated Value
Purchase Details
Closed on
Oct 12, 2005
Sold by
Calta Michael Gregory
Bought by
Calta Michael and Calta Gena
Home Financials for this Owner
Home Financials are based on the most recent Mortgage that was taken out on this home.
Original Mortgage
$359,650
Interest Rate
5.67%
Mortgage Type
New Conventional
Purchase Details
Closed on
Apr 3, 2003
Sold by
Calta Michael G
Bought by
Calta Michael Gregory and Calta Gena Kay
Purchase Details
Closed on
Dec 15, 1999
Sold by
Wl Homes Llc
Bought by
Calta Michael G and Calta Gena K
Home Financials for this Owner
Home Financials are based on the most recent Mortgage that was taken out on this home.
Original Mortgage
$185,000
Interest Rate
7.37%
Create a Home Valuation Report for This Property
The Home Valuation Report is an in-depth analysis detailing your home's value as well as a comparison with similar homes in the area
Home Values in the Area
Average Home Value in this Area
Purchase History
| Date | Buyer | Sale Price | Title Company |
|---|---|---|---|
| Gabriela Martinez Special Needs Trust | $428,000 | Investors Title Company | |
| Calta Michael | -- | First American Title Company | |
| Calta Michael Gregory | -- | -- | |
| Calta Michael G | $237,500 | Chicago Title |
Source: Public Records
Mortgage History
| Date | Status | Borrower | Loan Amount |
|---|---|---|---|
| Previous Owner | Calta Michael | $359,650 | |
| Previous Owner | Calta Michael G | $185,000 |
Source: Public Records
Tax History Compared to Growth
Tax History
| Year | Tax Paid | Tax Assessment Tax Assessment Total Assessment is a certain percentage of the fair market value that is determined by local assessors to be the total taxable value of land and additions on the property. | Land | Improvement |
|---|---|---|---|---|
| 2025 | $6,064 | $548,344 | $192,177 | $356,167 |
| 2024 | $6,064 | $537,592 | $188,409 | $349,183 |
| 2023 | $5,899 | $527,051 | $184,715 | $342,336 |
| 2022 | $5,865 | $516,717 | $181,093 | $335,624 |
| 2021 | $5,753 | $506,585 | $177,542 | $329,043 |
| 2020 | $5,680 | $501,391 | $175,722 | $325,669 |
| 2019 | $5,583 | $491,559 | $172,276 | $319,283 |
| 2018 | $5,462 | $481,921 | $168,898 | $313,023 |
| 2017 | $5,367 | $472,471 | $165,586 | $306,885 |
| 2016 | $5,021 | $463,207 | $162,339 | $300,868 |
| 2015 | $4,920 | $456,250 | $159,901 | $296,349 |
| 2014 | $4,825 | $447,313 | $156,769 | $290,544 |
Source: Public Records
Map
Nearby Homes
- 12132 Concord Ct
- 4400 Philadelphia St Unit 197
- 4400 Philadelphia St Unit 209
- 4400 Philadelphia St Unit 193
- 4024 Olive St
- 4025 Olive St
- 3964 Philadelphia St
- 3954 Wakefield Ave
- 12232 Roswell Ave
- 4625 Avondale Place
- 4099 Walnut Ave
- 12540 Ramona Ave
- 3921 Francis Ave
- 11818 Yorba Ave
- Maddox Plan at Yorba Estates
- Malone Plan at Yorba Estates
- Madeline Plan at Yorba Estates
- 12139 Serra Ave
- 4623 Granville St
- 11620 Sherwood Place
- 4253 Bryant St
- 4233 Bryant St
- 4242 Lombardy St
- 4263 Bryant St
- 4232 Lombardy St
- 4240 Bryant St
- 4262 Lombardy St
- 4230 Bryant St
- 4273 Bryant St
- 4250 Bryant St
- 4220 Bryant St
- 12140 Orgren Ave
- 4260 Bryant St
- 12130 Orgren Ave
- 4272 Lombardy St
- 12120 Orgren Ave
- 4283 Bryant St
- 12160 Orgren Ave Unit 280
- 4270 Bryant St
- 4210 Bryant St