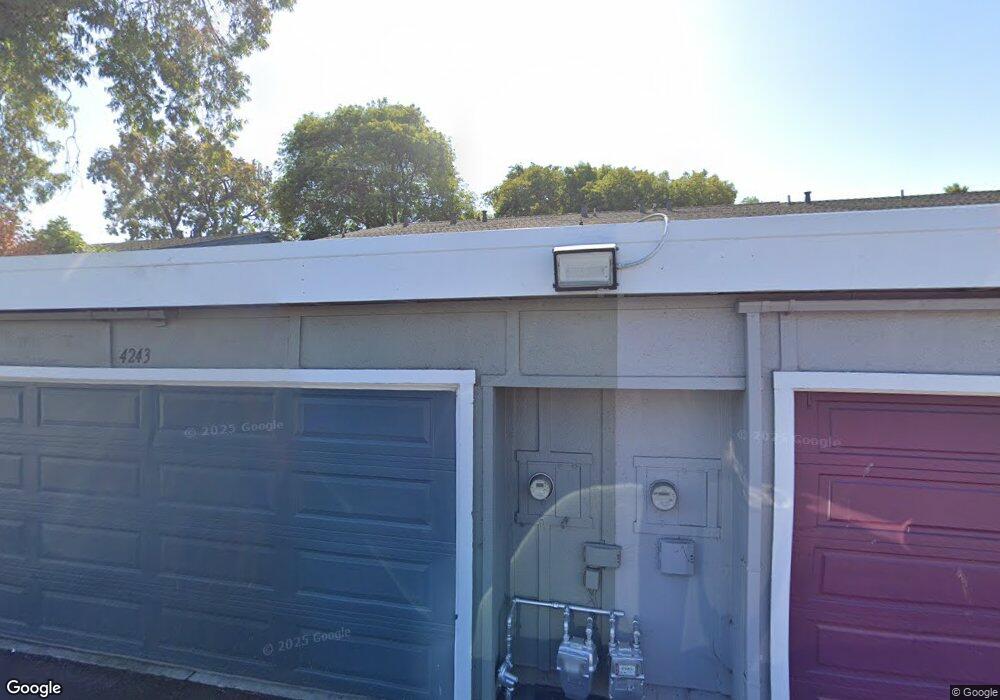
4243 Miramonte Way Union City, CA 94587
Alvarado NeighborhoodEstimated Value: $846,000 - $890,000
4
Beds
3
Baths
1,632
Sq Ft
$532/Sq Ft
Est. Value
About This Home
This home is located at 4243 Miramonte Way, Union City, CA 94587 and is currently estimated at $867,810, approximately $531 per square foot. 4243 Miramonte Way is a home located in Alameda County with nearby schools including Alvarado Elementary School, Itliong-Vera Cruz, and James Logan High School.
Ownership History
Date
Name
Owned For
Owner Type
Purchase Details
Closed on
Feb 25, 2025
Sold by
Vo Cu Van and La Vo Miki
Bought by
Cu Van Vo And Miki La Vo Revocable Trust and Vo
Current Estimated Value
Purchase Details
Closed on
Jun 22, 2001
Sold by
Singh Birinder and Nijjar Kulwant
Bought by
Vo Cu Van and Lavo Miki La
Home Financials for this Owner
Home Financials are based on the most recent Mortgage that was taken out on this home.
Original Mortgage
$215,000
Interest Rate
7.14%
Purchase Details
Closed on
Oct 1, 1999
Sold by
Kelly James E and Kelly Cathie
Bought by
Nijjar Singh Brinder and Nijjar Kulwant
Home Financials for this Owner
Home Financials are based on the most recent Mortgage that was taken out on this home.
Original Mortgage
$197,576
Interest Rate
7.75%
Mortgage Type
Purchase Money Mortgage
Create a Home Valuation Report for This Property
The Home Valuation Report is an in-depth analysis detailing your home's value as well as a comparison with similar homes in the area
Home Values in the Area
Average Home Value in this Area
Purchase History
| Date | Buyer | Sale Price | Title Company |
|---|---|---|---|
| Cu Van Vo And Miki La Vo Revocable Trust | -- | None Listed On Document | |
| Vo Cu Van | -- | None Listed On Document | |
| Vo Cu Van | $315,000 | Fidelity National Title Co | |
| Nijjar Singh Brinder | $205,000 | Fidelity National Title |
Source: Public Records
Mortgage History
| Date | Status | Borrower | Loan Amount |
|---|---|---|---|
| Previous Owner | Vo Cu Van | $215,000 | |
| Previous Owner | Nijjar Singh Brinder | $197,576 |
Source: Public Records
Tax History Compared to Growth
Tax History
| Year | Tax Paid | Tax Assessment Tax Assessment Total Assessment is a certain percentage of the fair market value that is determined by local assessors to be the total taxable value of land and additions on the property. | Land | Improvement |
|---|---|---|---|---|
| 2025 | $7,093 | $474,618 | $142,385 | $332,233 |
| 2024 | $7,093 | $465,314 | $139,594 | $325,720 |
| 2023 | $6,852 | $456,191 | $136,857 | $319,334 |
| 2022 | $6,726 | $447,248 | $134,174 | $313,074 |
| 2021 | $6,580 | $438,480 | $131,544 | $306,936 |
| 2020 | $6,451 | $433,984 | $130,195 | $303,789 |
| 2019 | $6,511 | $425,476 | $127,643 | $297,833 |
| 2018 | $6,360 | $417,134 | $125,140 | $291,994 |
| 2017 | $6,210 | $408,957 | $122,687 | $286,270 |
| 2016 | $5,984 | $400,941 | $120,282 | $280,659 |
| 2015 | $5,873 | $394,921 | $118,476 | $276,445 |
| 2014 | $5,662 | $387,187 | $116,156 | $271,031 |
Source: Public Records
Map
Nearby Homes
- 31226 Lily St
- 4167 Sunflower Ct
- 4263 Queen Anne Dr
- 4476 Madrid Ct
- 30996 Granger Ave
- 4633 Granada Way
- 30921 Union City Blvd Unit 30927
- 4214 Saturn Way
- 4325 Horner St
- 30784 Tidewater Dr
- 4501 Alice Way
- 4243 Comet Cir
- 3142 Sugar Beet Way
- 32451 Regents Blvd
- 32425 Pacific Grove Way
- 32542 Lake Tana St
- 3011 Risdon Dr Unit 8
- 32447 Pacific Grove Way
- 30300 Meridien Cir
- 3058 Flint St Unit 40
- 4245 Miramonte Way
- 4247 Miramonte Way
- 4239 Miramonte Way
- 4249 Miramonte Way
- 4237 Miramonte Way
- 4251 Miramonte Way
- 4235 Miramonte Way
- 4253 Miramonte Way
- 4233 Miramonte Way
- 4244 Miramonte Way
- 4242 Miramonte Way
- 4246 Miramonte Way
- 4248 Miramonte Way
- 4238 Miramonte Way
- 4255 Miramonte Way
- 4231 Miramonte Way
- 4236 Miramonte Way
- 4262 Las Feliz Ct
- 4250 Miramonte Way
- 4261 Las Feliz Ct