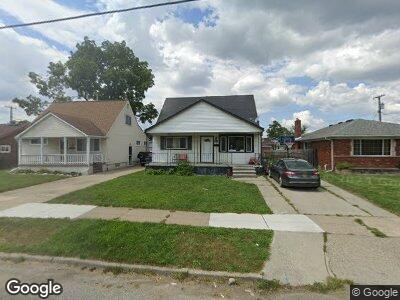
4244 11th St Ecorse, MI 48229
Estimated Value: $99,000 - $112,000
2
Beds
1
Bath
1,087
Sq Ft
$97/Sq Ft
Est. Value
About This Home
This home is located at 4244 11th St, Ecorse, MI 48229 and is currently estimated at $104,938, approximately $96 per square foot. 4244 11th St is a home located in Wayne County with nearby schools including Ralph J. Bunche Elementary, Grandport Academy, and Ecorse High School.
Ownership History
Date
Name
Owned For
Owner Type
Purchase Details
Closed on
Feb 17, 2016
Sold by
Harris Ira
Bought by
Hams Thomas
Current Estimated Value
Purchase Details
Closed on
Feb 17, 2014
Sold by
Cox George
Bought by
Harris Ira
Purchase Details
Closed on
Feb 4, 2009
Sold by
Brown Jerome
Bought by
Cox George Anthony
Purchase Details
Closed on
Mar 11, 2008
Sold by
Us Bank Na
Bought by
Brown Jerome
Purchase Details
Closed on
Feb 21, 2007
Sold by
Green Maudine
Bought by
Us Bank Na and Credit Suisse First Boston Mbs Heat 2004
Create a Home Valuation Report for This Property
The Home Valuation Report is an in-depth analysis detailing your home's value as well as a comparison with similar homes in the area
Home Values in the Area
Average Home Value in this Area
Purchase History
| Date | Buyer | Sale Price | Title Company |
|---|---|---|---|
| Hams Thomas | $2,500 | None Available | |
| Harris Ira | $2,500 | None Available | |
| Cox George Anthony | -- | None Available | |
| Us Bank Na | $75,746 | None Available |
Source: Public Records
Mortgage History
| Date | Status | Borrower | Loan Amount |
|---|---|---|---|
| Open | Harris Thomas | $13,411 | |
| Previous Owner | Green Maudine | $70,000 |
Source: Public Records
Tax History Compared to Growth
Tax History
| Year | Tax Paid | Tax Assessment Tax Assessment Total Assessment is a certain percentage of the fair market value that is determined by local assessors to be the total taxable value of land and additions on the property. | Land | Improvement |
|---|---|---|---|---|
| 2024 | $775 | $34,800 | $0 | $0 |
| 2023 | $737 | $30,000 | $0 | $0 |
| 2022 | $1,326 | $23,400 | $0 | $0 |
| 2021 | $1,358 | $18,400 | $0 | $0 |
| 2019 | $1,314 | $13,800 | $0 | $0 |
| 2018 | $616 | $11,400 | $0 | $0 |
| 2017 | $1,535 | $11,600 | $0 | $0 |
| 2016 | $1,874 | $12,700 | $0 | $0 |
| 2013 | $2,380 | $24,900 | $0 | $0 |
| 2012 | $1,488 | $26,000 | $3,800 | $22,200 |
Source: Public Records
Map
Nearby Homes