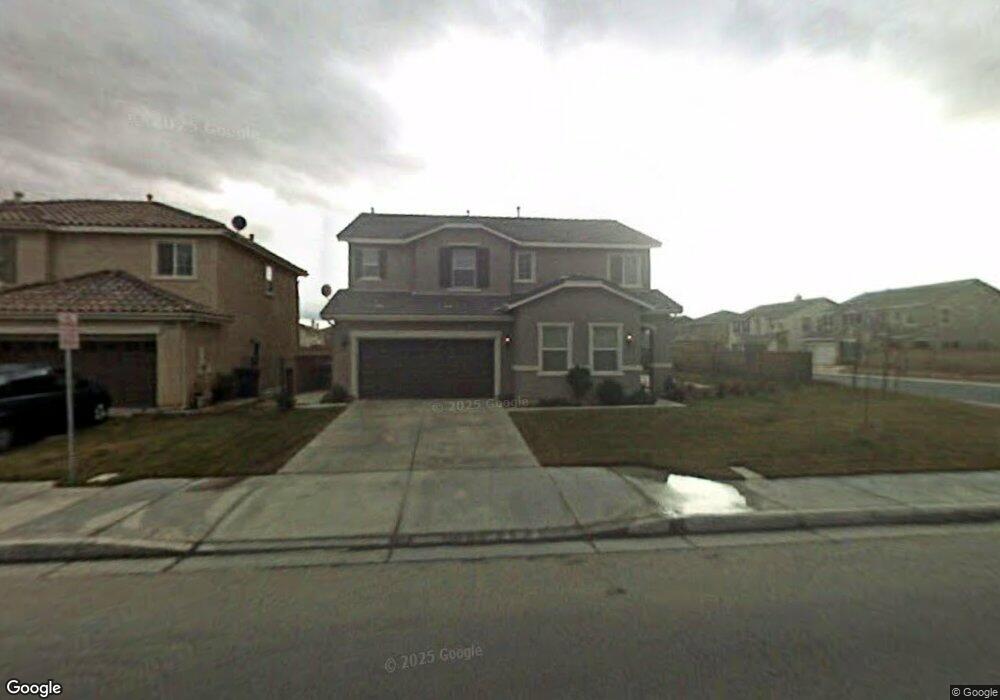
4246 Vahan Ct Lancaster, CA 93536
West Lancaster NeighborhoodEstimated Value: $540,884 - $610,000
3
Beds
3
Baths
2,523
Sq Ft
$226/Sq Ft
Est. Value
About This Home
This home is located at 4246 Vahan Ct, Lancaster, CA 93536 and is currently estimated at $569,721, approximately $225 per square foot. 4246 Vahan Ct is a home located in Los Angeles County with nearby schools including West Wind Elementary School, Endeavour Middle School, and Lancaster High School.
Ownership History
Date
Name
Owned For
Owner Type
Purchase Details
Closed on
Oct 29, 2008
Sold by
Wells Fargo Bank National Association
Bought by
Mena Juan and Murino Maria
Current Estimated Value
Home Financials for this Owner
Home Financials are based on the most recent Mortgage that was taken out on this home.
Original Mortgage
$224,043
Interest Rate
6.47%
Mortgage Type
Seller Take Back
Purchase Details
Closed on
Jul 14, 2008
Sold by
Wright Kimberly K
Bought by
Wells Fargo Bank Na and Morgan Stanley Abs Capital Inc Trust 200
Purchase Details
Closed on
Jan 17, 2005
Sold by
Western Pacific Housing Inc
Bought by
Wright Kimberly K
Home Financials for this Owner
Home Financials are based on the most recent Mortgage that was taken out on this home.
Original Mortgage
$284,957
Interest Rate
5.99%
Mortgage Type
Purchase Money Mortgage
Create a Home Valuation Report for This Property
The Home Valuation Report is an in-depth analysis detailing your home's value as well as a comparison with similar homes in the area
Home Values in the Area
Average Home Value in this Area
Purchase History
| Date | Buyer | Sale Price | Title Company |
|---|---|---|---|
| Mena Juan | $227,000 | Landsafe Title | |
| Wells Fargo Bank Na | $229,500 | Landsafe Title | |
| Wright Kimberly K | $361,500 | First American Title Co |
Source: Public Records
Mortgage History
| Date | Status | Borrower | Loan Amount |
|---|---|---|---|
| Previous Owner | Mena Juan | $224,043 | |
| Previous Owner | Wright Kimberly K | $284,957 | |
| Closed | Wright Kimberly K | $71,239 |
Source: Public Records
Tax History
| Year | Tax Paid | Tax Assessment Tax Assessment Total Assessment is a certain percentage of the fair market value that is determined by local assessors to be the total taxable value of land and additions on the property. | Land | Improvement |
|---|---|---|---|---|
| 2025 | $5,065 | $292,304 | $58,455 | $233,849 |
| 2024 | $5,065 | $286,573 | $57,309 | $229,264 |
| 2023 | $4,960 | $280,955 | $56,186 | $224,769 |
| 2022 | $4,737 | $275,447 | $55,085 | $220,362 |
| 2021 | $4,321 | $270,047 | $54,005 | $216,042 |
| 2019 | $4,197 | $262,039 | $52,404 | $209,635 |
| 2018 | $4,122 | $256,902 | $51,377 | $205,525 |
| 2016 | $3,896 | $246,929 | $49,383 | $197,546 |
| 2015 | $3,845 | $243,221 | $48,642 | $194,579 |
| 2014 | $3,810 | $238,458 | $47,690 | $190,768 |
Source: Public Records
Map
Nearby Homes
- 43929 44th St W
- 4225 Vahan Ct
- 4244 Jonathon St
- 43890 Moccasin Place
- 43834 Firewood Way
- 4019 W Avenue j9
- 0 47th St W
- 44047 Colony Ct
- 4727 Vahan Ct
- 4103 W Avenue j3
- 4103 W Avenue J 3
- 44302 Marbella St
- 3812 Jonathon Ct
- 43704 47th St W
- 3832 W Avenue j11
- 44130 Catsue Place
- 44108 Countryside Dr
- 4036 Via Rebecca
- 4536 Jade Ct
- 43648 Colony Dr
- 4238 Vahan Ct
- 43928 43rd St W
- 4308 Vahn Ct
- 4308 Vahan Ct
- 43922 43rd St W
- 4230 Vahan Ct
- 43929 Marbella St
- 4243 Vahan Ct
- 4249 Vahan Ct
- 43929 43rd St W
- 4237 Vahan Ct
- 43923 Marbella St
- 4303 Vahan Ct
- 43916 43rd St W
- 43923 43rd St W
- 4314 Vahan Ct
- 4231 Vahan Ct
- 4309 Vahan Ct
- 43917 Marbella St
- 43917 43rd St W
Your Personal Tour Guide
Ask me questions while you tour the home.