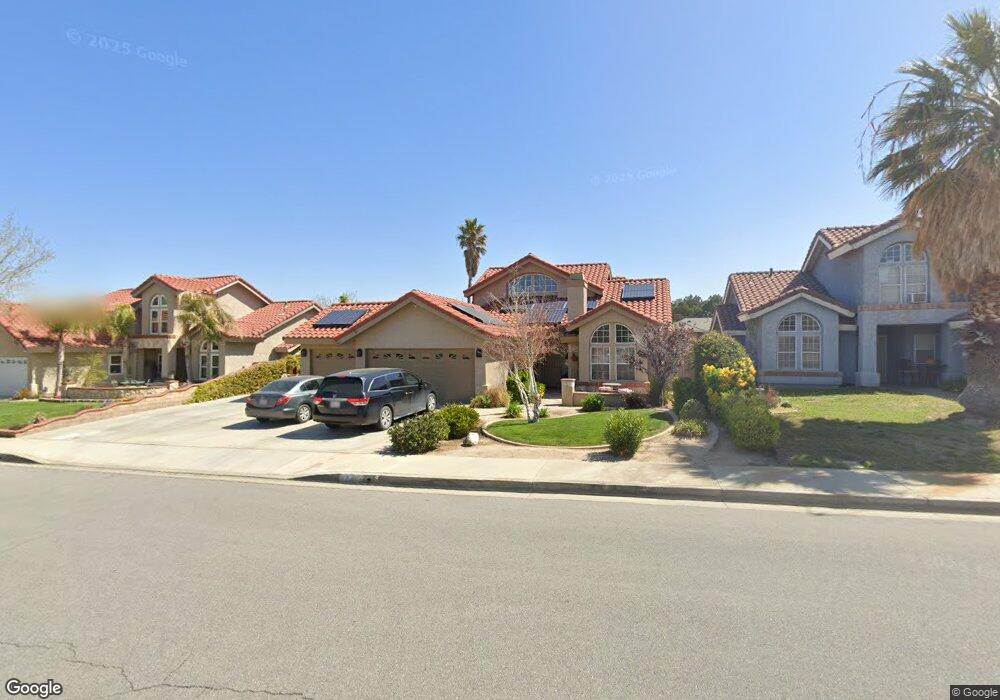
42464 61st St W Lancaster, CA 93536
West Lancaster NeighborhoodEstimated Value: $525,000 - $549,828
3
Beds
3
Baths
1,849
Sq Ft
$290/Sq Ft
Est. Value
About This Home
This home is located at 42464 61st St W, Lancaster, CA 93536 and is currently estimated at $536,957, approximately $290 per square foot. 42464 61st St W is a home located in Los Angeles County with nearby schools including Sundown Elementary School, Joe Walker Middle School, and Quartz Hill High School.
Ownership History
Date
Name
Owned For
Owner Type
Purchase Details
Closed on
Sep 25, 2024
Sold by
Bruce And Valerie Foley 2011 Family Trus and Foley Valerie G
Bought by
Chang Brian and Chang Aisling
Current Estimated Value
Home Financials for this Owner
Home Financials are based on the most recent Mortgage that was taken out on this home.
Original Mortgage
$520,400
Outstanding Balance
$514,772
Interest Rate
6.2%
Mortgage Type
FHA
Estimated Equity
$22,185
Purchase Details
Closed on
Jul 11, 2011
Sold by
Foley Bruce J and Foley Valerie G
Bought by
Foley Bruce J and Foley Valerie G
Purchase Details
Closed on
Jan 12, 2000
Sold by
Blaha Roy F Jr Tr Roy F Blaha Jr Trust
Bought by
Foley Bruce J and Foley Valerie G
Home Financials for this Owner
Home Financials are based on the most recent Mortgage that was taken out on this home.
Original Mortgage
$123,025
Interest Rate
7.96%
Create a Home Valuation Report for This Property
The Home Valuation Report is an in-depth analysis detailing your home's value as well as a comparison with similar homes in the area
Home Values in the Area
Average Home Value in this Area
Purchase History
| Date | Buyer | Sale Price | Title Company |
|---|---|---|---|
| Chang Brian | $530,000 | Chicago Title Company | |
| Foley Bruce J | -- | None Available | |
| Foley Bruce J | $129,500 | Chicago Title Co | |
| Foley Bruce J | $129,500 | Chicago Title Co |
Source: Public Records
Mortgage History
| Date | Status | Borrower | Loan Amount |
|---|---|---|---|
| Open | Chang Brian | $520,400 | |
| Previous Owner | Foley Bruce J | $123,025 |
Source: Public Records
Tax History
| Year | Tax Paid | Tax Assessment Tax Assessment Total Assessment is a certain percentage of the fair market value that is determined by local assessors to be the total taxable value of land and additions on the property. | Land | Improvement |
|---|---|---|---|---|
| 2025 | $3,645 | $530,000 | $205,300 | $324,700 |
| 2024 | $3,645 | $236,289 | $39,015 | $197,274 |
| 2023 | $3,617 | $231,656 | $38,250 | $193,406 |
| 2022 | $3,563 | $227,114 | $37,500 | $189,614 |
| 2021 | $3,505 | $222,662 | $36,765 | $185,897 |
| 2019 | $3,422 | $216,060 | $35,676 | $180,384 |
| 2018 | $3,376 | $211,825 | $34,977 | $176,848 |
| 2016 | $3,202 | $203,602 | $33,620 | $169,982 |
| 2015 | $3,167 | $200,544 | $33,115 | $167,429 |
| 2014 | $3,156 | $196,617 | $32,467 | $164,150 |
Source: Public Records
Map
Nearby Homes
- 42427 61st St W
- 6001 Brougham St
- 42419 62nd St W
- 5840 Almond Valley Way
- 42350 Encanto Way
- 42519 Cinnabar Ct
- 42665 Tempo Dr
- 5619 W Avenue l4
- 42734 56th St W
- 6652 Lacolle Place
- 5817 Gem Ct
- 6608 Teasdale St
- 5711 Columbia Way Unit Spc 137
- 5711 Columbia Way Unit 137
- 5711 Columbia Way Unit Spc 80
- 5711 Columbia Way Unit 96
- 5711 Columbia Way Unit Spc 231
- 5711 Columbia Way Unit 96
- 5711 Columbia Way Unit 187
- 5711 Columbia Way Unit 57
- 42460 61st St W
- 42502 61st St W
- 42454 61st St W
- 42510 W 61 St Quartz Hill
- 42510 61st St Quartz Hill
- 42510 61st St W
- 42507 Carriage Way
- 42525 Carriage Way
- 42501 Carriage Way
- 42501 Carriage Way
- 6101 Phaeton Place
- 42461 61st St W
- 42531 Carriage Way
- 42455 61st St W
- 6104 Landau Place
- 42440 61st St W
- 6109 Phaeton Place
- 42449 61st St W
- 42526 61st St W
Your Personal Tour Guide
Ask me questions while you tour the home.