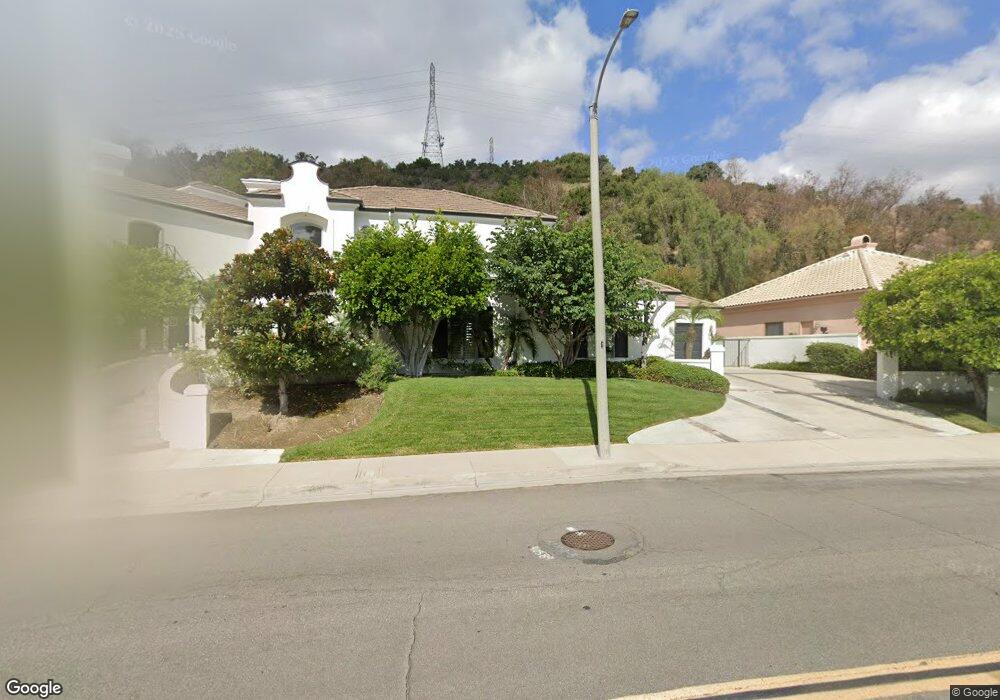
4247 E Cerro Villa Dr Orange, CA 92867
Estimated Value: $1,873,000 - $2,659,138
4
Beds
5
Baths
4,339
Sq Ft
$564/Sq Ft
Est. Value
About This Home
This home is located at 4247 E Cerro Villa Dr, Orange, CA 92867 and is currently estimated at $2,445,535, approximately $563 per square foot. 4247 E Cerro Villa Dr is a home located in Orange County with nearby schools including Serrano Elementary School, Cerro Villa Middle School, and Villa Park High School.
Ownership History
Date
Name
Owned For
Owner Type
Purchase Details
Closed on
Aug 14, 2024
Sold by
Priem John J
Bought by
John J Priem Trust and Priem
Current Estimated Value
Purchase Details
Closed on
Jan 20, 2011
Sold by
Pnem John J and Pnem John
Bought by
Pnem John J
Home Financials for this Owner
Home Financials are based on the most recent Mortgage that was taken out on this home.
Original Mortgage
$850,000
Interest Rate
4.82%
Mortgage Type
Seller Take Back
Purchase Details
Closed on
Oct 6, 1998
Sold by
Priem John J
Bought by
Priem John J and Priem John
Home Financials for this Owner
Home Financials are based on the most recent Mortgage that was taken out on this home.
Original Mortgage
$575,000
Interest Rate
3.95%
Purchase Details
Closed on
May 12, 1994
Sold by
Villa Ridge Development Inc
Bought by
Priem John J
Create a Home Valuation Report for This Property
The Home Valuation Report is an in-depth analysis detailing your home's value as well as a comparison with similar homes in the area
Home Values in the Area
Average Home Value in this Area
Purchase History
| Date | Buyer | Sale Price | Title Company |
|---|---|---|---|
| John J Priem Trust | -- | None Listed On Document | |
| Pnem John J | -- | None Available | |
| Priem John J | -- | Fidelity National Title Ins | |
| Priem John J | $375,000 | Fidelity National Title Ins |
Source: Public Records
Mortgage History
| Date | Status | Borrower | Loan Amount |
|---|---|---|---|
| Previous Owner | Pnem John J | $850,000 | |
| Previous Owner | Priem John J | $575,000 |
Source: Public Records
Tax History
| Year | Tax Paid | Tax Assessment Tax Assessment Total Assessment is a certain percentage of the fair market value that is determined by local assessors to be the total taxable value of land and additions on the property. | Land | Improvement |
|---|---|---|---|---|
| 2025 | $11,430 | $1,070,840 | $293,947 | $776,893 |
| 2024 | $11,430 | $1,049,844 | $288,184 | $761,660 |
| 2023 | $11,179 | $1,029,259 | $282,533 | $746,726 |
| 2022 | $10,965 | $1,009,078 | $276,993 | $732,085 |
| 2021 | $10,119 | $938,116 | $271,562 | $666,554 |
| 2020 | $10,025 | $928,497 | $268,777 | $659,720 |
| 2019 | $9,896 | $910,292 | $263,507 | $646,785 |
| 2018 | $9,743 | $892,444 | $258,341 | $634,103 |
| 2017 | $9,332 | $874,946 | $253,276 | $621,670 |
| 2016 | $9,150 | $857,791 | $248,310 | $609,481 |
| 2015 | $9,016 | $844,907 | $244,580 | $600,327 |
| 2014 | $8,823 | $828,357 | $239,789 | $588,568 |
Source: Public Records
Map
Nearby Homes
- 18605 Villa Dr
- 4011 E Green Clover Cir
- 18782 Peppertree Dr
- 9312 Smoketree Ln
- 9531 Lemon St
- 3624 E Shallow Brook Ln
- 18262 Pamela Place
- 18811 Ridgeview Cir
- 18411 Hillcrest Ave
- 656 S Andover Dr
- 2910 E Shady Forest Ln
- 640 S Londerry Ln
- 18221 Windsor Dr
- 18301 Churchill Ln
- 10041 Sycamore St
- 0 Cannon St
- 415 S Brook Ln
- 5706 E Bryce Ave
- 420 S Rolling Hills Place
- 5598 E Stetson Ct Unit 22
- 4315 E Cerro Villa Dr
- 4235 E Cerro Villa Dr
- 18571 Rosenau Dr
- 18551 Rosenau Dr
- 4331 E Cerro Villa Dr
- 18591 Rosenau Dr
- 18601 Rosenau Dr
- 4119 E Rolling Green Ln
- 18541 Rosenau Dr
- 18651 Cerro Villa Dr
- 4349 E Cerro Villa Dr
- 4118 E Rolling Green Ln
- 4117 E Rolling Green Ln
- 18562 Rosenau Dr
- 18631 Rosenau Dr
- 4109 E Rolling Green Ln
- 9261 Tritt Cir
- 4411 E Cerro Villa Dr
- 18521 Rosenau Dr
- 18541 Rosenau Cir
Your Personal Tour Guide
Ask me questions while you tour the home.