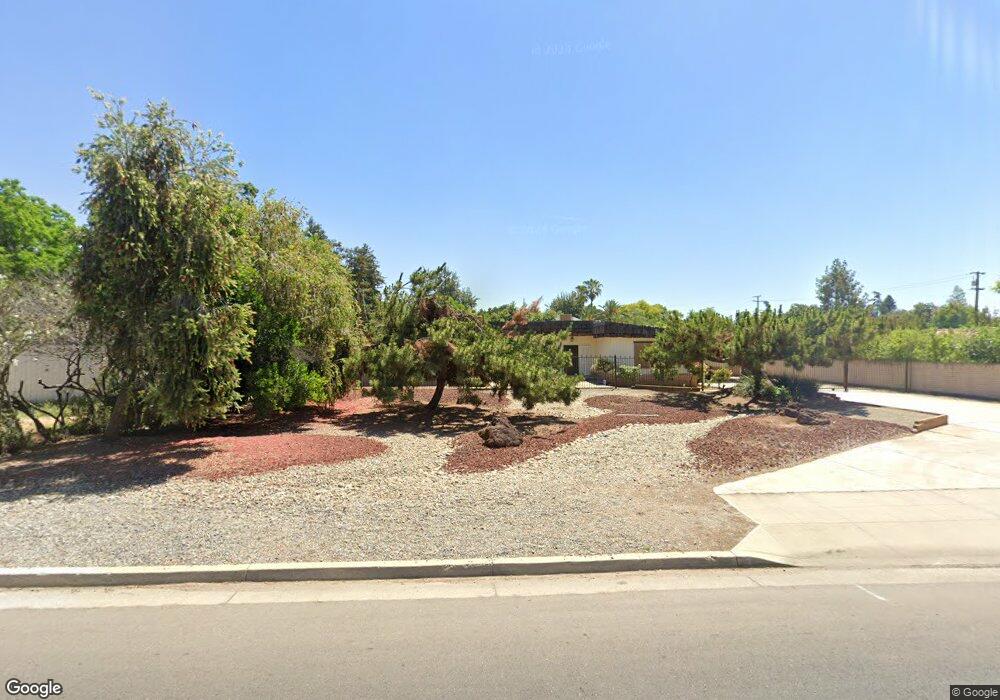
4248 N Palm Ave Fresno, CA 93704
Fig Garden NeighborhoodEstimated Value: $643,000 - $900,113
6
Beds
4
Baths
3,355
Sq Ft
$233/Sq Ft
Est. Value
About This Home
This home is located at 4248 N Palm Ave, Fresno, CA 93704 and is currently estimated at $781,778, approximately $233 per square foot. 4248 N Palm Ave is a home located in Fresno County with nearby schools including Powers-Ginsburg Elementary, Bullard High School, and Endeavor Charter.
Ownership History
Date
Name
Owned For
Owner Type
Purchase Details
Closed on
Jun 7, 2010
Sold by
Deutsche Bank National Trust Company
Bought by
Blythe Timothy A
Current Estimated Value
Home Financials for this Owner
Home Financials are based on the most recent Mortgage that was taken out on this home.
Original Mortgage
$174,400
Outstanding Balance
$115,846
Interest Rate
4.79%
Mortgage Type
New Conventional
Estimated Equity
$665,932
Purchase Details
Closed on
Sep 23, 2009
Sold by
Angulo Maria G and Angulo Transito
Bought by
Deutsche Bank National Trust Company
Purchase Details
Closed on
Jul 21, 2006
Sold by
The Derl W & Shirley M Keen Revocable Li
Bought by
Angulo Maria G and Angulo Trasito
Home Financials for this Owner
Home Financials are based on the most recent Mortgage that was taken out on this home.
Original Mortgage
$387,000
Interest Rate
8.45%
Mortgage Type
Balloon
Purchase Details
Closed on
Oct 15, 2003
Sold by
Keen Derl W and Keen Shirley M
Bought by
Keen Derl W and Keen Shirley M
Create a Home Valuation Report for This Property
The Home Valuation Report is an in-depth analysis detailing your home's value as well as a comparison with similar homes in the area
Home Values in the Area
Average Home Value in this Area
Purchase History
| Date | Buyer | Sale Price | Title Company |
|---|---|---|---|
| Blythe Timothy A | $218,000 | Servicelink | |
| Deutsche Bank National Trust Company | $336,405 | Servicelink | |
| Angulo Maria G | $430,000 | Fidelity National Title Co | |
| Keen Derl W | -- | -- |
Source: Public Records
Mortgage History
| Date | Status | Borrower | Loan Amount |
|---|---|---|---|
| Open | Blythe Timothy A | $174,400 | |
| Previous Owner | Angulo Maria G | $387,000 |
Source: Public Records
Tax History Compared to Growth
Tax History
| Year | Tax Paid | Tax Assessment Tax Assessment Total Assessment is a certain percentage of the fair market value that is determined by local assessors to be the total taxable value of land and additions on the property. | Land | Improvement |
|---|---|---|---|---|
| 2025 | $5,370 | $320,281 | $76,865 | $243,416 |
| 2023 | $5,240 | $307,846 | $73,881 | $233,965 |
| 2022 | $5,147 | $301,811 | $72,433 | $229,378 |
| 2021 | $4,951 | $295,894 | $71,013 | $224,881 |
| 2020 | $4,867 | $292,861 | $70,285 | $222,576 |
| 2019 | $4,776 | $287,119 | $68,907 | $218,212 |
| 2018 | $4,638 | $281,490 | $67,556 | $213,934 |
| 2017 | $4,536 | $275,972 | $66,232 | $209,740 |
| 2016 | $4,386 | $270,562 | $64,934 | $205,628 |
| 2015 | $4,308 | $266,499 | $63,959 | $202,540 |
| 2014 | $4,237 | $261,280 | $62,707 | $198,573 |
Source: Public Records
Map
Nearby Homes
- 4175 N Van Ness Blvd
- 4480 N Palm Ave
- 4481 N Palm Ave
- 94 E Sussex Way
- 82 E Sussex Way
- 336 E Gettysburg Ave
- 3932 N Safford Ave
- 556 E Pontiac Way
- 4666 N Harrison Ave
- 825 E Indianapolis Ave
- 4689 N Van Ness Blvd
- 4678 N Thorne Ave
- 4355 N College Ave
- 4734 N Harrison Ave
- 4822 N Safford Ave
- 3723 N Van Ness Blvd
- 4843 N Palm Ave
- 1020 E Saginaw Way
- 4702 N Fruit Ave
- 116 E Alamos Ave
- 4266 N Palm Ave
- 4232 N Palm Ave
- 4288 N Palm Ave
- 307 E Ashlan Ave
- 341 E Ashlan Ave
- 344 E Swift Ave
- 4245 N Palm Ave
- 4251 N Wilson Ave
- 405 E Ashlan Ave
- 4233 N Palm Ave
- 4265 N Palm Ave
- 4227 N Wilson Ave
- 4269 N Wilson Ave
- 414 E Swift Ave
- 425 E Ashlan Ave
- 4285 N Palm Ave
- 4215 N Palm Ave
- 325 E Swift Ave
- 330 E Ashlan Ave
- 301 E Swift Ave