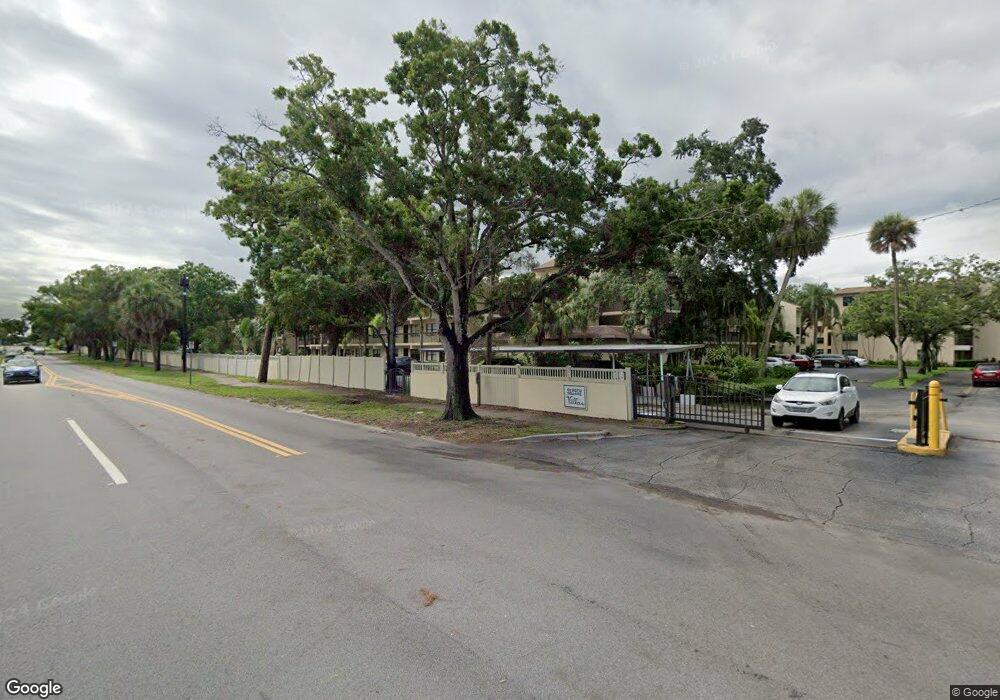
425 30th Ave W Unit 107C Bradenton, FL 34205
South Bradenton NeighborhoodEstimated Value: $109,000 - $124,000
2
Beds
2
Baths
1,050
Sq Ft
$112/Sq Ft
Est. Value
About This Home
This home is located at 425 30th Ave W Unit 107C, Bradenton, FL 34205 and is currently estimated at $117,866, approximately $112 per square foot. 425 30th Ave W Unit 107C is a home located in Manatee County with nearby schools including G.D. Rogers Garden - Bullock Elementary School, Martha B. King Middle School, and Southeast High School.
Ownership History
Date
Name
Owned For
Owner Type
Purchase Details
Closed on
Jun 4, 2021
Sold by
Coyle David
Bought by
Bennett Ronald C and Bennett Brenda J
Current Estimated Value
Purchase Details
Closed on
Jun 30, 2020
Sold by
Offerpad Spvborrower1 Llc
Bought by
Coyle David
Home Financials for this Owner
Home Financials are based on the most recent Mortgage that was taken out on this home.
Original Mortgage
$83,420
Interest Rate
3.2%
Mortgage Type
New Conventional
Purchase Details
Closed on
Sep 11, 2019
Sold by
Hall Robert J and Hall Sara A
Bought by
Offerpad Llc
Purchase Details
Closed on
Apr 8, 2011
Sold by
Schmitt Reba D
Bought by
Hall Robert J and Hall Sara A
Purchase Details
Closed on
Dec 18, 2009
Sold by
Campbell Deborah L and The Rainey Trust
Bought by
Schmitt Marvel M and Schmitt Reba D
Purchase Details
Closed on
May 3, 2002
Sold by
Wilkinson Marian E
Bought by
Rainey Charlene
Create a Home Valuation Report for This Property
The Home Valuation Report is an in-depth analysis detailing your home's value as well as a comparison with similar homes in the area
Home Values in the Area
Average Home Value in this Area
Purchase History
| Date | Buyer | Sale Price | Title Company |
|---|---|---|---|
| Bennett Ronald C | $131,000 | Attorney | |
| Coyle David | $86,000 | First American Title Ins Co | |
| Offerpad Llc | $101,712 | First American Title Ins Co | |
| Hall Robert J | $43,000 | Sunbelt Title Agency | |
| Schmitt Marvel M | $62,500 | Alliance Group Title Llc | |
| Rainey Charlene | $50,000 | -- |
Source: Public Records
Mortgage History
| Date | Status | Borrower | Loan Amount |
|---|---|---|---|
| Previous Owner | Coyle David | $83,420 |
Source: Public Records
Tax History
| Year | Tax Paid | Tax Assessment Tax Assessment Total Assessment is a certain percentage of the fair market value that is determined by local assessors to be the total taxable value of land and additions on the property. | Land | Improvement |
|---|---|---|---|---|
| 2025 | $2,422 | $132,600 | -- | $132,600 |
| 2023 | $2,339 | $158,100 | $0 | $158,100 |
| 2022 | $1,953 | $113,400 | $0 | $113,400 |
| 2021 | $766 | $87,000 | $0 | $87,000 |
| 2020 | $1,528 | $83,500 | $0 | $83,500 |
| 2019 | $1,447 | $81,000 | $0 | $81,000 |
| 2018 | $1,304 | $69,000 | $0 | $0 |
| 2017 | $427 | $40,990 | $0 | $0 |
| 2016 | $412 | $40,147 | $0 | $0 |
| 2015 | $396 | $39,868 | $0 | $0 |
| 2014 | $396 | $39,552 | $0 | $0 |
| 2013 | $736 | $35,865 | $1 | $35,864 |
Source: Public Records
Map
Nearby Homes
- 315 30th Ave W Unit B305
- 425 30th Ave W Unit C204
- 305 30th Ave W Unit A111
- 305 30th Ave W Unit A308
- 315 30th Ave W Unit B201
- 425 30th Ave W Unit C211
- 425 30th Ave W Unit C104
- 425 30th Ave W Unit C102
- 425 30th Ave W Unit C112
- 425 30th Ave W Unit C206
- 305 30th Ave W Unit A208
- 315 30th Ave W Unit B212
- 435 30th Ave W Unit D303
- 435 30th Ave W Unit D314
- 390 301 Blvd W Unit 8A
- 390 301 Blvd W Unit 5B
- 390 301 Blvd W Unit 11D
- 390 301 Blvd W Unit 20A
- 390 301 Blvd W Unit 27C
- 390 301 Blvd W Unit 12A
- 425 30th Ave W Unit 301C
- 315 30th Ave W Unit 401B
- 315 30th Ave W Unit 207B
- 315 30th Ave W Unit 112B
- 305 30th Ave W Unit 206A
- 425 30th Ave W Unit 312C
- 305 30th Ave W
- 425 30th Ave W
- 315 30th Ave W Unit B306
- 425 30th Ave W Unit 209C
- 425 30th Ave W Unit 311C
- 315 30th Ave W Unit 411B
- 425 30th Ave W Unit C214
- 425 30th Ave W Unit C314
- 315 30th Ave W Unit B411
- 305 30th Ave W Unit A305
- 305 30th Ave W Unit A304
- 425 30th Ave W Unit C304
- 425 30th Ave W Unit C107
- 425 30th Ave W Unit C114
Your Personal Tour Guide
Ask me questions while you tour the home.