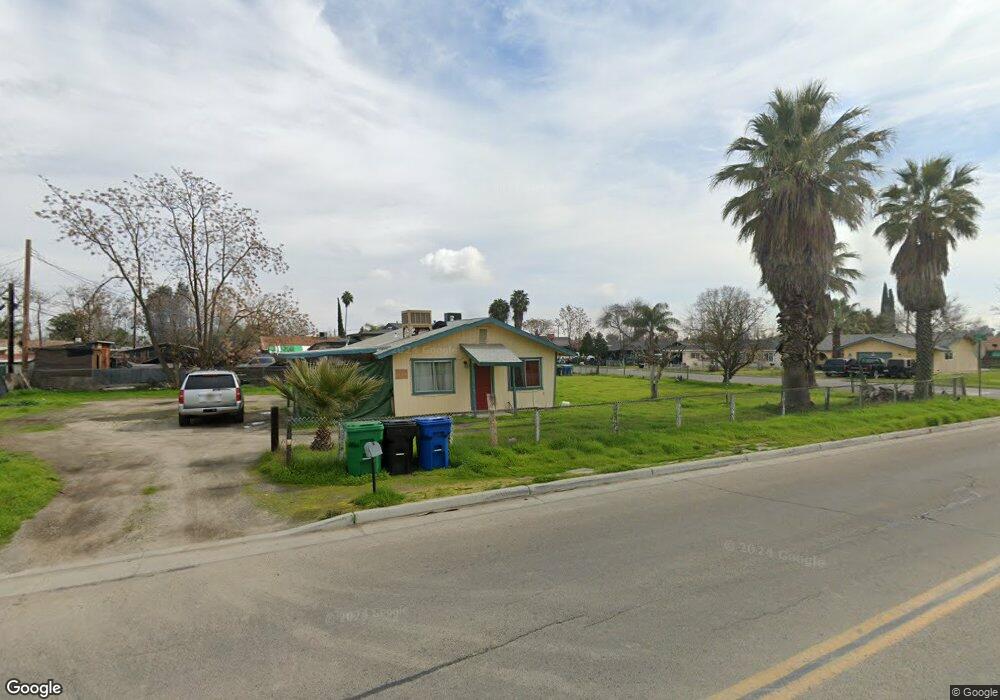
425 6 1/2 Ave Corcoran, CA 93212
Estimated Value: $92,000 - $212,000
2
Beds
1
Bath
816
Sq Ft
$199/Sq Ft
Est. Value
About This Home
This home is located at 425 6 1/2 Ave, Corcoran, CA 93212 and is currently estimated at $162,555, approximately $199 per square foot. 425 6 1/2 Ave is a home located in Kings County with nearby schools including John C. Fremont Elementary School, Bret Harte Elementary School, and Mark Twain Elementary School.
Ownership History
Date
Name
Owned For
Owner Type
Purchase Details
Closed on
May 24, 2001
Sold by
Bank Of New York
Bought by
Jch Family Ltd Partnership and Dbh Family Ltd Partnership
Current Estimated Value
Purchase Details
Closed on
Sep 7, 2000
Sold by
Saenz Alvin
Bought by
Countrywide Home Loans Inc
Purchase Details
Closed on
Feb 19, 1999
Sold by
Saenz Sarah
Bought by
Saenz Alvin
Home Financials for this Owner
Home Financials are based on the most recent Mortgage that was taken out on this home.
Original Mortgage
$50,840
Interest Rate
6.7%
Purchase Details
Closed on
Jul 7, 1998
Sold by
Saenz Sarah and Saenz Paul
Bought by
Saenz Sarah and Saenz Alvin
Home Financials for this Owner
Home Financials are based on the most recent Mortgage that was taken out on this home.
Original Mortgage
$39,975
Interest Rate
7.01%
Purchase Details
Closed on
Jun 24, 1996
Sold by
Saenz Sarah
Bought by
Saenz Sarah and Saenz Paul
Create a Home Valuation Report for This Property
The Home Valuation Report is an in-depth analysis detailing your home's value as well as a comparison with similar homes in the area
Purchase History
| Date | Buyer | Sale Price | Title Company |
|---|---|---|---|
| Jch Family Ltd Partnership | $28,000 | First American Title Co | |
| Countrywide Home Loans Inc | $55,952 | Chicago Title Insurance Co | |
| Saenz Alvin | -- | First American Title | |
| Saenz Sarah | -- | United Title Company | |
| Saenz Sarah | -- | -- |
Source: Public Records
Mortgage History
| Date | Status | Borrower | Loan Amount |
|---|---|---|---|
| Previous Owner | Saenz Alvin | $50,840 | |
| Previous Owner | Saenz Sarah | $39,975 |
Source: Public Records
Tax History
| Year | Tax Paid | Tax Assessment Tax Assessment Total Assessment is a certain percentage of the fair market value that is determined by local assessors to be the total taxable value of land and additions on the property. | Land | Improvement |
|---|---|---|---|---|
| 2025 | $610 | $58,762 | $22,598 | $36,164 |
| 2023 | $610 | $56,481 | $21,721 | $34,760 |
| 2022 | $590 | $55,375 | $21,296 | $34,079 |
| 2021 | $579 | $54,290 | $20,879 | $33,411 |
| 2020 | $573 | $53,733 | $20,665 | $33,068 |
| 2019 | $708 | $52,680 | $20,260 | $32,420 |
| 2018 | $701 | $51,647 | $19,863 | $31,784 |
| 2017 | $688 | $50,635 | $19,474 | $31,161 |
| 2016 | $537 | $49,642 | $19,092 | $30,550 |
| 2015 | $536 | $48,896 | $18,805 | $30,091 |
| 2014 | $527 | $47,939 | $18,437 | $29,502 |
Source: Public Records
Map
Nearby Homes
- 446 6 1 2 Ave
- 2312 North Ave
- 2632 North Ave
- 2414 Strepy Ave
- 2615 Gable Ave
- 2310 Patterson Ave
- 2323 Patterson Ave
- 2220 North Ave
- 504 Benrus Ave
- 2217 Gable Ave
- #12 Corral St
- 2113 Garvey Ave
- 725 James Ave
- 2023 Garvey Ave
- 2611 Hanna Ave
- 1766 North Ave
- 510 Claire Ave
- 508 Claire Ave
- 310 Wawona Ave
- 0 Patterson Ave
- 2428 Lorina Ave
- 608 6 1/2 Ave
- 2429 North Ave
- 2437 Lorina Ave
- 2426 Lorina Ave
- 2431 Lorina Ave
- 2427 Lorina Ave
- 2427 North Ave
- 2420 Lorina Ave
- 2423 North Ave
- 2423 Lorina Ave
- 2419 North Ave
- 563 6 1/2 Ave
- 2430 North Ave
- 2412 Lorina Ave
- 2419 Lorina Ave
- 2426 North Ave
- 625 6 1/2 Ave
- 2430 Bell Ave
- 562 Rickover Ct
Your Personal Tour Guide
Ask me questions while you tour the home.