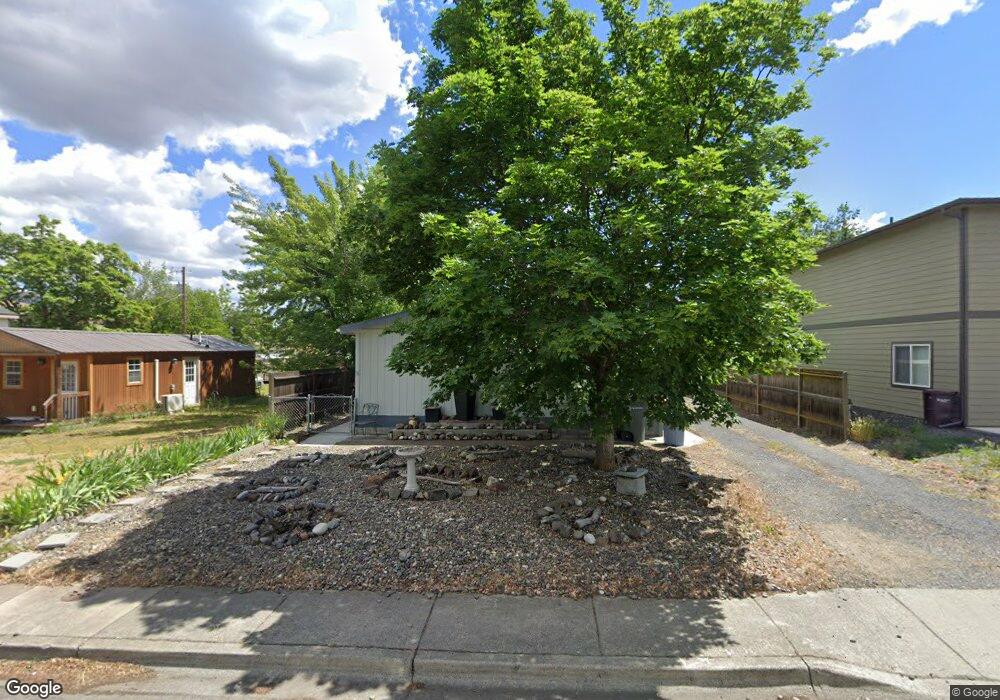
425 7th St Clarkston, WA 99403
Estimated Value: $177,000 - $320,000
4
Beds
2
Baths
1,620
Sq Ft
$146/Sq Ft
Est. Value
About This Home
This home is located at 425 7th St, Clarkston, WA 99403 and is currently estimated at $236,667, approximately $146 per square foot. 425 7th St is a home located in Asotin County with nearby schools including Grantham Elementary School, Lincoln Middle School, and Charles Francis Adams High School.
Ownership History
Date
Name
Owned For
Owner Type
Purchase Details
Closed on
Jan 16, 2018
Sold by
Harrington Elizabeth A
Bought by
Harrington Elizabeth A
Current Estimated Value
Purchase Details
Closed on
Sep 18, 2015
Sold by
Harrington Robert A
Bought by
Harrington Robert A
Home Financials for this Owner
Home Financials are based on the most recent Mortgage that was taken out on this home.
Original Mortgage
$37,000
Interest Rate
3.9%
Mortgage Type
Purchase Money Mortgage
Create a Home Valuation Report for This Property
The Home Valuation Report is an in-depth analysis detailing your home's value as well as a comparison with similar homes in the area
Home Values in the Area
Average Home Value in this Area
Purchase History
| Date | Buyer | Sale Price | Title Company |
|---|---|---|---|
| Harrington Elizabeth A | -- | None Available | |
| Harrington Robert A | -- | Alliance Title & Escrow |
Source: Public Records
Mortgage History
| Date | Status | Borrower | Loan Amount |
|---|---|---|---|
| Closed | Harrington Robert A | $37,000 |
Source: Public Records
Tax History Compared to Growth
Tax History
| Year | Tax Paid | Tax Assessment Tax Assessment Total Assessment is a certain percentage of the fair market value that is determined by local assessors to be the total taxable value of land and additions on the property. | Land | Improvement |
|---|---|---|---|---|
| 2025 | $303 | $103,400 | $30,000 | $73,400 |
| 2023 | $303 | $103,400 | $30,000 | $73,400 |
| 2022 | $295 | $103,400 | $30,000 | $73,400 |
| 2021 | $270 | $103,400 | $30,000 | $73,400 |
| 2020 | $259 | $103,400 | $30,000 | $73,400 |
| 2019 | $268 | $98,600 | $25,500 | $73,100 |
| 2018 | $1,298 | $98,600 | $25,500 | $73,100 |
| 2017 | $1,216 | $98,600 | $25,500 | $73,100 |
| 2016 | $1,216 | $98,600 | $25,500 | $73,100 |
| 2015 | $121 | $95,800 | $25,500 | $70,300 |
| 2013 | $1,220 | $93,800 | $25,500 | $68,300 |
Source: Public Records
Map
Nearby Homes