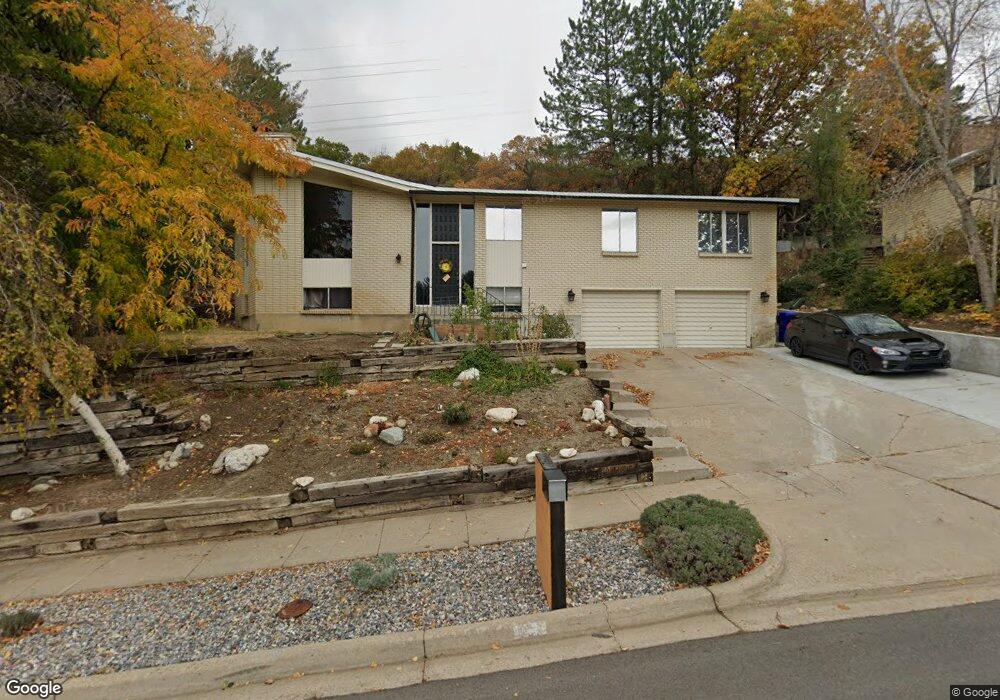
425 Brentwood Ln Bountiful, UT 84010
Estimated Value: $593,000 - $662,000
4
Beds
3
Baths
2,751
Sq Ft
$231/Sq Ft
Est. Value
About This Home
This home is located at 425 Brentwood Ln, Bountiful, UT 84010 and is currently estimated at $636,606, approximately $231 per square foot. 425 Brentwood Ln is a home located in Davis County with nearby schools including Oak Hills School, Millcreek Junior High School, and Bountiful High School.
Ownership History
Date
Name
Owned For
Owner Type
Purchase Details
Closed on
Sep 28, 2016
Sold by
Connor Seamus A Houchins and Connor Sarah J
Bought by
Mabey Thomas E and Mabey Kyle R
Current Estimated Value
Purchase Details
Closed on
Aug 24, 2012
Sold by
Small Kevin S
Bought by
Conner Seamus A Houchins and Connor Sarah J
Home Financials for this Owner
Home Financials are based on the most recent Mortgage that was taken out on this home.
Original Mortgage
$220,924
Interest Rate
3.25%
Mortgage Type
FHA
Purchase Details
Closed on
Jan 30, 2006
Sold by
Small Joyce A and Small Kevin S
Bought by
Small Joyce A and Joyce A Small Inter Vivos Trust
Purchase Details
Closed on
Apr 30, 2004
Sold by
Small Joyce A
Bought by
Small Joyce A and Small Kevin S
Create a Home Valuation Report for This Property
The Home Valuation Report is an in-depth analysis detailing your home's value as well as a comparison with similar homes in the area
Home Values in the Area
Average Home Value in this Area
Purchase History
| Date | Buyer | Sale Price | Title Company |
|---|---|---|---|
| Mabey Thomas E | -- | Sutherland Title | |
| Conner Seamus A Houchins | -- | Mountain View Title & | |
| Small Joyce A | -- | None Available | |
| Small Joyce A | -- | Cottonwood Title Ins Agency |
Source: Public Records
Mortgage History
| Date | Status | Borrower | Loan Amount |
|---|---|---|---|
| Previous Owner | Conner Seamus A Houchins | $220,924 |
Source: Public Records
Tax History Compared to Growth
Tax History
| Year | Tax Paid | Tax Assessment Tax Assessment Total Assessment is a certain percentage of the fair market value that is determined by local assessors to be the total taxable value of land and additions on the property. | Land | Improvement |
|---|---|---|---|---|
| 2025 | $3,498 | $317,350 | $117,907 | $199,443 |
| 2024 | $3,411 | $321,200 | $108,591 | $212,609 |
| 2023 | $3,415 | $585,000 | $198,456 | $386,544 |
| 2022 | $3,510 | $330,000 | $105,894 | $224,106 |
| 2021 | $3,175 | $457,000 | $157,522 | $299,478 |
| 2020 | $2,729 | $380,000 | $143,398 | $236,602 |
| 2019 | $2,637 | $370,000 | $137,807 | $232,193 |
| 2018 | $2,471 | $341,000 | $128,479 | $212,521 |
| 2016 | $2,218 | $166,265 | $61,471 | $104,794 |
| 2015 | $2,186 | $154,715 | $61,471 | $93,244 |
| 2014 | $2,216 | $161,746 | $61,471 | $100,275 |
| 2013 | -- | $127,892 | $68,867 | $59,025 |
Source: Public Records
Map
Nearby Homes
- 144 Bountiful Blvd
- 183 S 1300 E
- 914 E Lakeview Dr S
- 1399 E Millbrook Way
- 111 Eagle Ridge Dr
- 1596 E Millbrook Way
- 1735 S Temple Ct Unit 203
- 551 N 1100 E
- 967 E 350 N
- 1342 E Skyline Dr N Unit 30
- 1785 1450 E Unit 604
- 718 E 200 S
- 861 E Millbrook Way
- 81 S 700 E
- 1342 Northridge Dr
- 1375 Northridge Dr
- 908 Northern Hills Dr
- 689 E 200 N
- 538 N 750 E
- 1820 S High Pointe Dr
- 405 Brentwood Ln
- 453 Brentwood Ln
- 336 S 1550 E
- 426 Brentwood Ln
- 399 Brentwood Ln
- 331 S 1550 E
- 331 S 1550 E Unit 3
- 454 Brentwood Ln
- 402 Brentwood Ln
- 483 Brentwood Ln
- 483 Brentwood Ln Unit 23
- 322 S 1550 E
- 325 Brentwood Ln
- 1456 Brentwood Ln
- 423 Oakview Ln
- 494 Brentwood Ln
- 455 Oakview Ln
- 509 Brentwood Ln
- 485 Oakview Ln
- 436 Templeview Dr