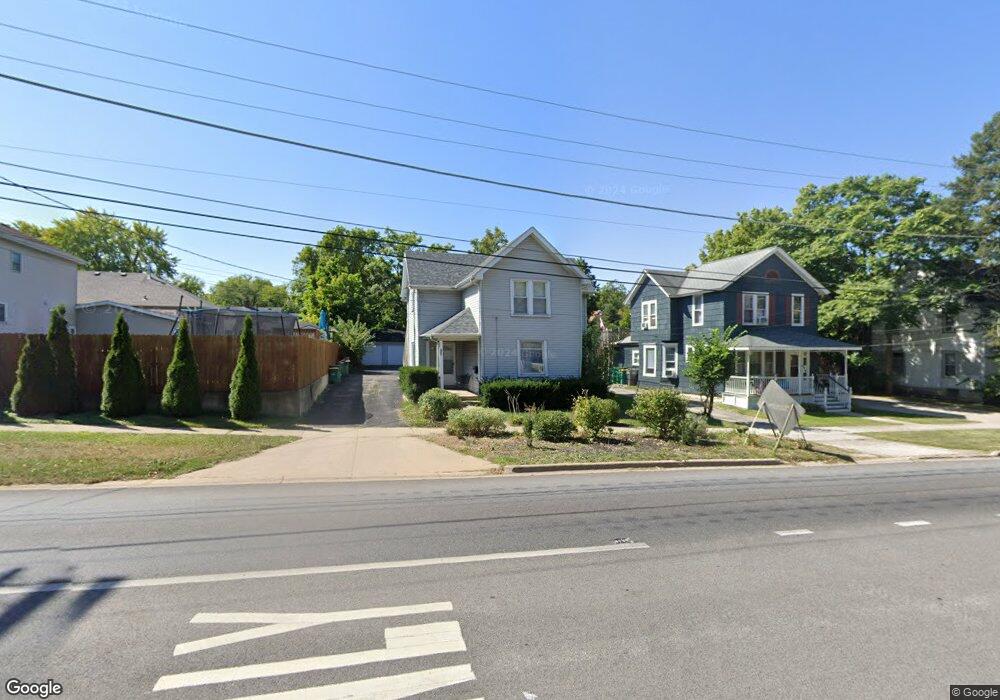
425 E 9th St Lockport, IL 60441
Estimated Value: $266,673 - $529,000
Studio
1
Bath
--
Sq Ft
8,712
Sq Ft Lot
About This Home
This home is located at 425 E 9th St, Lockport, IL 60441 and is currently estimated at $362,168. 425 E 9th St is a home located in Will County with nearby schools including Milne Grove Elementary School, Kelvin Grove Jr High School, and Lockport Township High School East.
Ownership History
Date
Name
Owned For
Owner Type
Purchase Details
Closed on
Apr 30, 2020
Sold by
Glockler Judith C and The Judith C Glockler Family T
Bought by
Cajc11 Trusts
Current Estimated Value
Purchase Details
Closed on
Jan 20, 2015
Sold by
Glockler Judith C and Glocker Christian A
Bought by
Glockler Judith C and Judith C Glockler Family Trust
Purchase Details
Closed on
Nov 11, 2003
Sold by
Glockler Michelle
Bought by
Glockler Christian A and Glockler Judith
Home Financials for this Owner
Home Financials are based on the most recent Mortgage that was taken out on this home.
Original Mortgage
$140,000
Outstanding Balance
$65,355
Interest Rate
6.1%
Mortgage Type
New Conventional
Estimated Equity
$296,813
Purchase Details
Closed on
Aug 10, 1995
Sold by
First National Bank Of Lockport
Bought by
Glockler Christian A and Glockler Judith C
Home Financials for this Owner
Home Financials are based on the most recent Mortgage that was taken out on this home.
Original Mortgage
$72,800
Interest Rate
7.64%
Create a Home Valuation Report for This Property
The Home Valuation Report is an in-depth analysis detailing your home's value as well as a comparison with similar homes in the area
Home Values in the Area
Average Home Value in this Area
Purchase History
| Date | Buyer | Sale Price | Title Company |
|---|---|---|---|
| Cajc11 Trusts | -- | None Available | |
| Glockler Judith C | -- | None Available | |
| Glockler Christian A | -- | -- | |
| Glockler Christian A | $104,000 | -- |
Source: Public Records
Mortgage History
| Date | Status | Borrower | Loan Amount |
|---|---|---|---|
| Open | Glockler Christian A | $140,000 | |
| Closed | Glockler Christian A | $72,800 |
Source: Public Records
Tax History
| Year | Tax Paid | Tax Assessment Tax Assessment Total Assessment is a certain percentage of the fair market value that is determined by local assessors to be the total taxable value of land and additions on the property. | Land | Improvement |
|---|---|---|---|---|
| 2024 | $6,533 | $76,095 | $20,958 | $55,137 |
| 2023 | $6,533 | $68,314 | $18,815 | $49,499 |
| 2022 | $5,866 | $63,724 | $17,550 | $46,174 |
| 2021 | $5,582 | $59,886 | $16,493 | $43,393 |
| 2020 | $5,493 | $57,917 | $15,951 | $41,966 |
| 2019 | $5,199 | $54,897 | $15,119 | $39,778 |
| 2018 | $4,923 | $50,749 | $13,976 | $36,773 |
| 2017 | $4,578 | $46,066 | $12,687 | $33,379 |
| 2016 | $4,332 | $42,494 | $11,703 | $30,791 |
| 2015 | $4,454 | $42,302 | $10,407 | $31,895 |
| 2014 | $4,454 | $40,675 | $10,007 | $30,668 |
| 2013 | $4,454 | $41,505 | $10,211 | $31,294 |
Source: Public Records
Map
Nearby Homes
- 1112 S Jefferson St
- 217 E 11th St
- 118 E 11th St
- 1016 S State St
- 1120 S Hamilton St
- 316 E 13th St
- 1100 S State St
- 1200 S State St
- 1509 East St Unit ST1511
- 1505 East St
- 500 Clinton St
- 134 S Jefferson St
- 1212 Grandview Ave
- 107 S State St
- 417 Thornton St
- 120 N State St
- 118 N State St
- 752 Rosanne St
- 1709 S State St
- 629 Thornton St
- 529 E 9th St Unit 2W
- 529 E 9th St Unit 1W
- 529 E 9th St Unit 1
- 425 E 9th St Unit 2
- 419 E 9th St
- 421 E 9th St
- 909 Madison St
- 433 E 9th St
- 915 Madison St
- 917 Madison St
- 413 E 9th St
- 918 S Jefferson St
- 420 E 10th St
- 920 S Jefferson St
- 929 Madison St
- 426 E 9th St
- 416 E 9th St
- 902 S Jefferson St
- 432 E 9th St
- 410 E 9th St
Your Personal Tour Guide
Ask me questions while you tour the home.