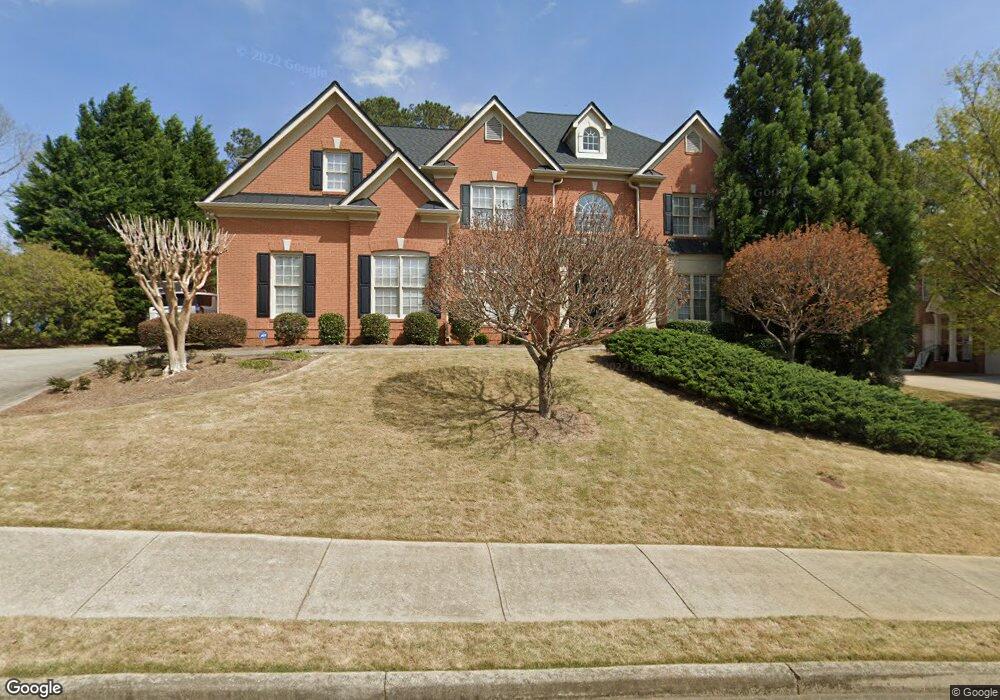
425 Garrick Point Alpharetta, GA 30022
Estimated Value: $1,222,000 - $1,359,000
5
Beds
4
Baths
4,143
Sq Ft
$307/Sq Ft
Est. Value
About This Home
This home is located at 425 Garrick Point, Alpharetta, GA 30022 and is currently estimated at $1,272,626, approximately $307 per square foot. 425 Garrick Point is a home located in Fulton County with nearby schools including New Prospect Elementary School, Webb Bridge Middle School, and Alpharetta High School.
Ownership History
Date
Name
Owned For
Owner Type
Purchase Details
Closed on
Jun 2, 2006
Sold by
Peterson John S and Peterson Denise F
Bought by
Sloan George B and Sloan Jennifer L
Current Estimated Value
Home Financials for this Owner
Home Financials are based on the most recent Mortgage that was taken out on this home.
Original Mortgage
$270,000
Outstanding Balance
$158,115
Interest Rate
6.5%
Mortgage Type
New Conventional
Estimated Equity
$1,114,511
Purchase Details
Closed on
Aug 30, 2001
Sold by
Ray Vick Builders Inc
Bought by
Peterson John S and Peterson Denise F
Home Financials for this Owner
Home Financials are based on the most recent Mortgage that was taken out on this home.
Original Mortgage
$419,241
Interest Rate
7.02%
Mortgage Type
New Conventional
Create a Home Valuation Report for This Property
The Home Valuation Report is an in-depth analysis detailing your home's value as well as a comparison with similar homes in the area
Home Values in the Area
Average Home Value in this Area
Purchase History
| Date | Buyer | Sale Price | Title Company |
|---|---|---|---|
| Sloan George B | $745,100 | -- | |
| Peterson John S | $524,100 | -- |
Source: Public Records
Mortgage History
| Date | Status | Borrower | Loan Amount |
|---|---|---|---|
| Open | Sloan George B | $270,000 | |
| Previous Owner | Peterson John S | $419,241 |
Source: Public Records
Tax History Compared to Growth
Tax History
| Year | Tax Paid | Tax Assessment Tax Assessment Total Assessment is a certain percentage of the fair market value that is determined by local assessors to be the total taxable value of land and additions on the property. | Land | Improvement |
|---|---|---|---|---|
| 2025 | $1,425 | $425,640 | $129,120 | $296,520 |
| 2023 | $10,231 | $362,480 | $84,960 | $277,520 |
| 2022 | $6,813 | $294,440 | $62,400 | $232,040 |
| 2021 | $7,833 | $264,120 | $62,280 | $201,840 |
| 2020 | $7,961 | $267,480 | $47,440 | $220,040 |
| 2019 | $1,222 | $262,760 | $46,600 | $216,160 |
| 2018 | $6,900 | $256,560 | $45,480 | $211,080 |
| 2017 | $6,450 | $233,000 | $47,960 | $185,040 |
| 2016 | $6,449 | $233,000 | $47,960 | $185,040 |
| 2015 | $7,615 | $233,000 | $47,960 | $185,040 |
| 2014 | $6,252 | $216,720 | $44,600 | $172,120 |
Source: Public Records
Map
Nearby Homes
- 215 Radlett Ln
- 4345 Park Brooke Trace
- 745 Culworth Manor
- 870 Longstone Landing
- 11640 Folia Cir
- 2040 Whitestone Place Unit 71
- 11190 Wittenridge Dr
- 920 Bridge Pointe Ct
- 12035 Castleton Ct
- 11000 Kimball Crest Dr
- 305 Kimball Trace
- 3920 Brookline Dr
- 10900 Wittenridge Dr Unit H8
- 10900 Wittenridge Dr Unit J8
- 10900 Wittenridge Dr Unit C7
- Rosalynn Plan at Hawthorn
- 465 Kirkstall Trail
- 275 Snowgoose Ct
- 535 Tumbling Creek Dr Unit 6
- 320 Snowgoose Ct
- 435 Garrick Point
- 415 Garrick Point
- 660 Wednesbury Rd
- 650 Wednesbury Rd Unit IX
- 100 Burford Hollow
- 430 Garrick Point
- 430 Garrick Point Unit 7
- 445 Garrick Point
- 670 Wednesbury Rd
- 640 Wednesbury Rd
- 405 Garrick Point
- 400 Garrick Point Unit VIII
- 110 Burford Hollow
- 555 Barnesley Ln
- 455 Garrick Point
- 115 Burford Hollow
- 630 Wednesbury Rd
- 680 Wednesbury Rd
- 545 Barnesley Ln
- 1000 Lainston Ct