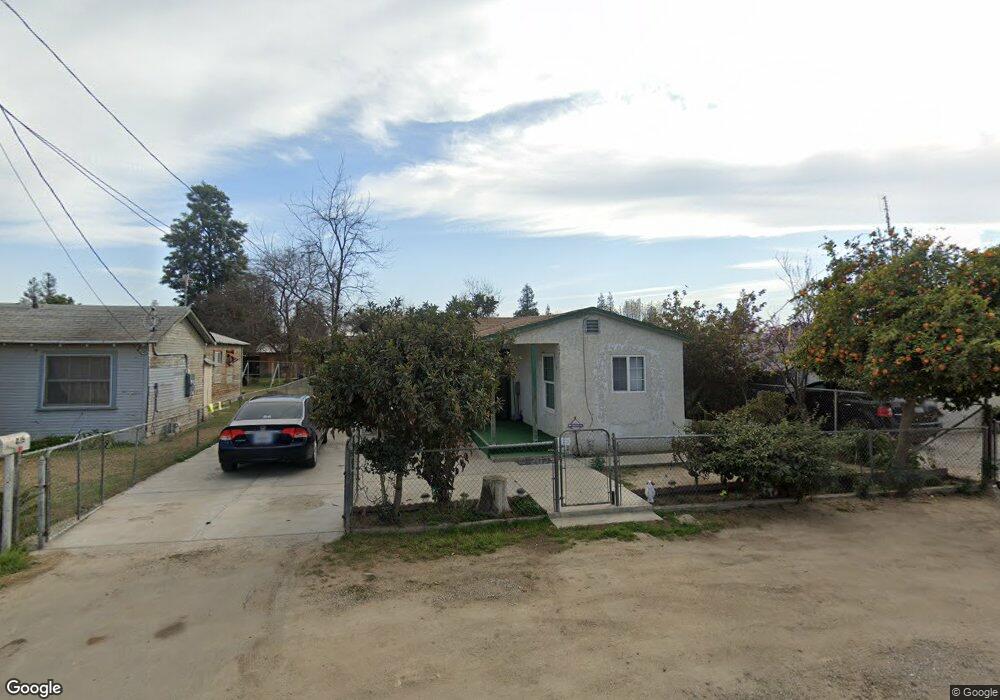
425 Gibson Ln Shafter, CA 93263
Estimated Value: $78,000 - $243,000
3
Beds
1
Bath
704
Sq Ft
$242/Sq Ft
Est. Value
About This Home
This home is located at 425 Gibson Ln, Shafter, CA 93263 and is currently estimated at $170,272, approximately $241 per square foot. 425 Gibson Ln is a home located in Kern County with nearby schools including Redwood Elementary School, Golden Oak Elementary School, and Shafter High School.
Ownership History
Date
Name
Owned For
Owner Type
Purchase Details
Closed on
Jun 26, 2013
Sold by
Ortega Rona Joy
Bought by
Arizmendi Xavier
Current Estimated Value
Home Financials for this Owner
Home Financials are based on the most recent Mortgage that was taken out on this home.
Original Mortgage
$49,600
Outstanding Balance
$11,882
Interest Rate
4.17%
Mortgage Type
New Conventional
Estimated Equity
$158,390
Purchase Details
Closed on
Jan 5, 1998
Sold by
Montoya Miguel and Montoya Maria
Bought by
Arizmendi Xavier and Arizmendi Javier
Home Financials for this Owner
Home Financials are based on the most recent Mortgage that was taken out on this home.
Original Mortgage
$43,650
Interest Rate
6.97%
Mortgage Type
FHA
Purchase Details
Closed on
Jun 16, 1997
Sold by
Hill Onita
Bought by
Montoya Miguel and Montoya Maria
Create a Home Valuation Report for This Property
The Home Valuation Report is an in-depth analysis detailing your home's value as well as a comparison with similar homes in the area
Home Values in the Area
Average Home Value in this Area
Purchase History
| Date | Buyer | Sale Price | Title Company |
|---|---|---|---|
| Arizmendi Xavier | -- | None Available | |
| Arizmendi Xavier | $43,000 | Commonwealth Land Title Co | |
| Montoya Miguel | $20,000 | First American Title Ins Co |
Source: Public Records
Mortgage History
| Date | Status | Borrower | Loan Amount |
|---|---|---|---|
| Open | Arizmendi Xavier | $49,600 | |
| Closed | Arizmendi Xavier | $43,650 |
Source: Public Records
Tax History Compared to Growth
Tax History
| Year | Tax Paid | Tax Assessment Tax Assessment Total Assessment is a certain percentage of the fair market value that is determined by local assessors to be the total taxable value of land and additions on the property. | Land | Improvement |
|---|---|---|---|---|
| 2025 | $1,136 | $68,627 | $23,934 | $44,693 |
| 2024 | $1,102 | $67,282 | $23,465 | $43,817 |
| 2023 | $1,102 | $65,963 | $23,005 | $42,958 |
| 2022 | $1,045 | $64,670 | $22,554 | $42,116 |
| 2021 | $985 | $63,403 | $22,112 | $41,291 |
| 2020 | $949 | $62,754 | $21,886 | $40,868 |
| 2019 | $947 | $62,754 | $21,886 | $40,868 |
| 2018 | $916 | $60,319 | $21,037 | $39,282 |
| 2017 | $909 | $59,137 | $20,625 | $38,512 |
| 2016 | $870 | $57,978 | $20,221 | $37,757 |
| 2015 | $842 | $57,108 | $19,918 | $37,190 |
| 2014 | $813 | $55,990 | $19,528 | $36,462 |
Source: Public Records
Map
Nearby Homes
- 509 Prince Ln
- 401 Klassen St
- 617 Sammy Way
- 419 Santa Maria Way
- 681 California 43
- 732 Sammy Way
- 436 N Reiker St
- 553 Grundy Ave
- 30142 W Tulare Ave
- 188 N Wall St
- 200 Justin Ct
- 269 Burns Ct
- 738 Fresno Ave
- 790 Fresno Ave
- 155 Redwood Dr
- 208 California Ave
- 780 Mayer Ln
- 1008 Eckmann St
- 1143 Park Ln
- 915 Tomboy Ct
- 417 Gibson Ln
- 433 Gibson Ln
- 409 Gibson Ln
- 441 Gibson Ln
- 376 Arroyo Seco Ave
- 364 Arroyo Seco Ave
- 364 Arroyo Seco Ave
- 401 Gibson Ln
- 449 Gibson Ln
- 388 Arroyo Seco Ave
- 406 Arroyo Seco Ave
- 340 Arroyo Seco Ave
- 457 Gibson Ln
- 424 Gibson Ln
- 416 Gibson Ln
- 432 Gibson Ln
- 412 Gibson Ln
- 440 Gibson Ln
- 418 Arroyo Seco Ave
- 328 Arroyo Seco Ave